I was wondering if there is an easy way to visualize DF simulation results for each floor with being able to hide results from other floors. (also for other annual daylight recipes)
To make it clear, when using visualization set component for GH-plug-in for a multiple floor building, is there a way to hide results from 2nd floor and only visualize results for the 5th floor? I understand this has something to do with generating sensor grids and using a grid filter for the post processing.
Is that we should eventually provide automated options for grouping Radiance results into different layers (aka. AnalysisGeometries ). VisualizationSets already support multiple analysis geometry objects (or layers) but I know that you were thinking of cases that could be addressed by exporting each SensorGrid to it’s own layer. I suspect that @hlkocalioglu 's model is set up with one SensorGrid per room, which could easily result in hundreds of layers, each with different metrics (eg. cDA, DA, and UDI for annual daylight), which will be unwieldy unless we make some changes to our viewer and interfaces. Grouping the results by floor height seems like it might be a more immediately practical way of structuring this so I’m glad that @hlkocalioglu brought this up.
Grouping the results by floor height seems like it might be a more immediately practical way of structuring this so I’m glad that @hlkocalioglu brought this up.
Agreed! I think that should address most of the cases that the users have asked for.
One item that I’m not sure about is how to manage the legends in Rhino after breaking down the grid into smaller ones. Maybe we should add an option to Rhino to allow hiding the legend for analysis geometries so we can keep only one of them visible. That’s another topic to think about. It feels like the ideal scenario is having multiple meshes that are governed by the same legend parameter - however that will introduce a major change to the schema.
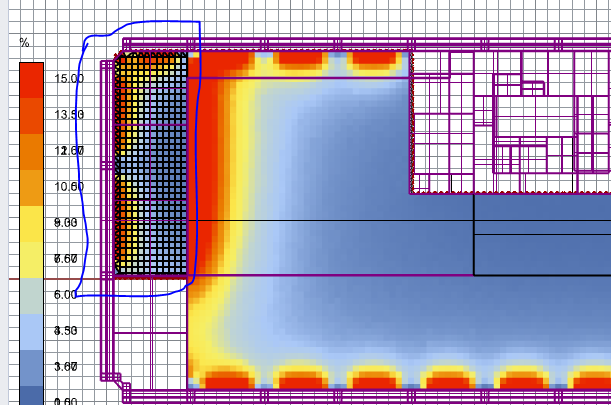
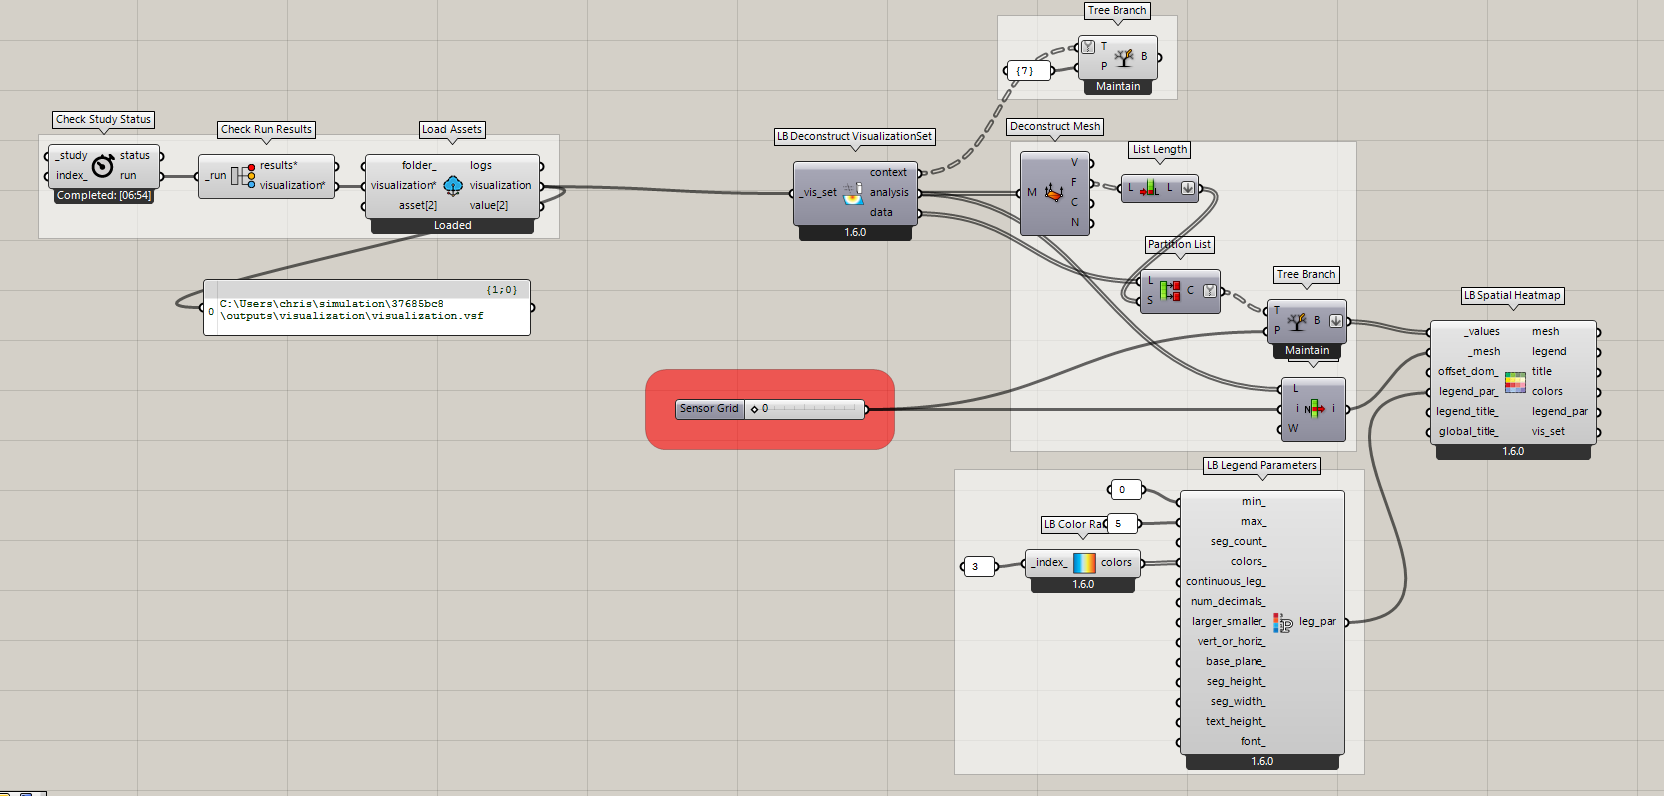
Since you only have 2 sensor grids in your model, it turns out that we don’t need to do any extra grouping by floor. I put together a simple Grasshopper script that takes any VisualizationSet and let’s you scroll through the different AnalysisGeomtry meshes one by one using a slider:
In the screenshot, I get the .vsf file from your run but you can just as easily plug in the path to the already-downloaded .vsf file on your system. Or you can use the “PO VisualizationSet” component to bring the VisualizationSet into Grasshopper from the Rhino plugin.
Let me know if this is good enough or if you would really rather have a Rhino document with two separate AnalysisGeometries that you can show/hide. As @mostapha says, the only major downside of that is that you’d have two separate legends to manage.
Ah, now you’re coming around to my perspective, @mostapha , since this is essentially how the schema of AnalysisGeometries currently works. The AnalysisGeometry in @hlkocalioglu 's example has two separate meshes linked to the same AnalysisGeometry data stream, indicating that you’re supposed to have two meshes linked to the same legend parameters.
The issue is just that the Rhino plugin and the Pollination Viewer currently ignore this fact and instead flatten everything into a single Mesh. Only in Grasshopper and the core libraries can I currently make use of how the schema is actually structured.
Long story short, we don’t really need a schema overhaul to get what we want. We just need to make the Rhino plugin and/or viewer able to use everything that’s built into the current VisualizationSet schema.
Thank you, @chriswmackey! I see your point but I don’t think the issue is just on the viewers. I think the schema needs some improvement to make what you have in mind easy to implement.
You’re right that meshes are there but there is no metadata attached to them (e.g. level 1, level 2, or the name of the original sensor grid) for the viewers to build separate objects for them. If we want to create separate objects for them then, at least in the Pollination Viewer we need them to have their own name.
I think at least from the two cases that we have seen so far this is one of those cases that the case is implicit to other developers. If the intention is that these meshes should be previewed as separate entities, I think, there should be an explicit separation between the objects.
Hi @chriswmackey - Thanks for the GH script. It did solve the problem. On the other hand, I believe the next question is what could be done for a model which includes several sensor grids for multiple floors.
Thanks, @mostapha and I understand. You want the names of the sensor grids to carry through to the meshes in the AnalysisGeometry. We should be able to add an optional property for this in the AnalysisGeometry schema with some auto-generated names if the user did not assign any. That’s really straightforward from a schema perspective since it seems pretty clear that we want to keep the flexibility of not having to name every analysis mesh if let’s say there’s only one mesh we want to visualize. But we can carry over this data from HBJSON sensor grids when we want.
Assuming that I do this, do you think we would be able to get the multiple sensor grid meshes to be controlled by a single legend in the viewer as I imagine people would want for this case? So people only have to worry about setting up the legend up once and not 100 times for 100 different sensor grids generated from 100 rooms? Then they could turn off each of the meshes to see the different Rooms or Floors as they wish.
If you think that is achievable, I’ll gladly implement the schema change a soon as I get the chance because I agree it’s a valuable feature.
I think you see that the Grasshopper script is meant to handle as many meshes as you might have and you just have to increase the slider to accommodate the number of sensor grids in your model or plug in multiple sliders if you want to display more than one mesh at once.
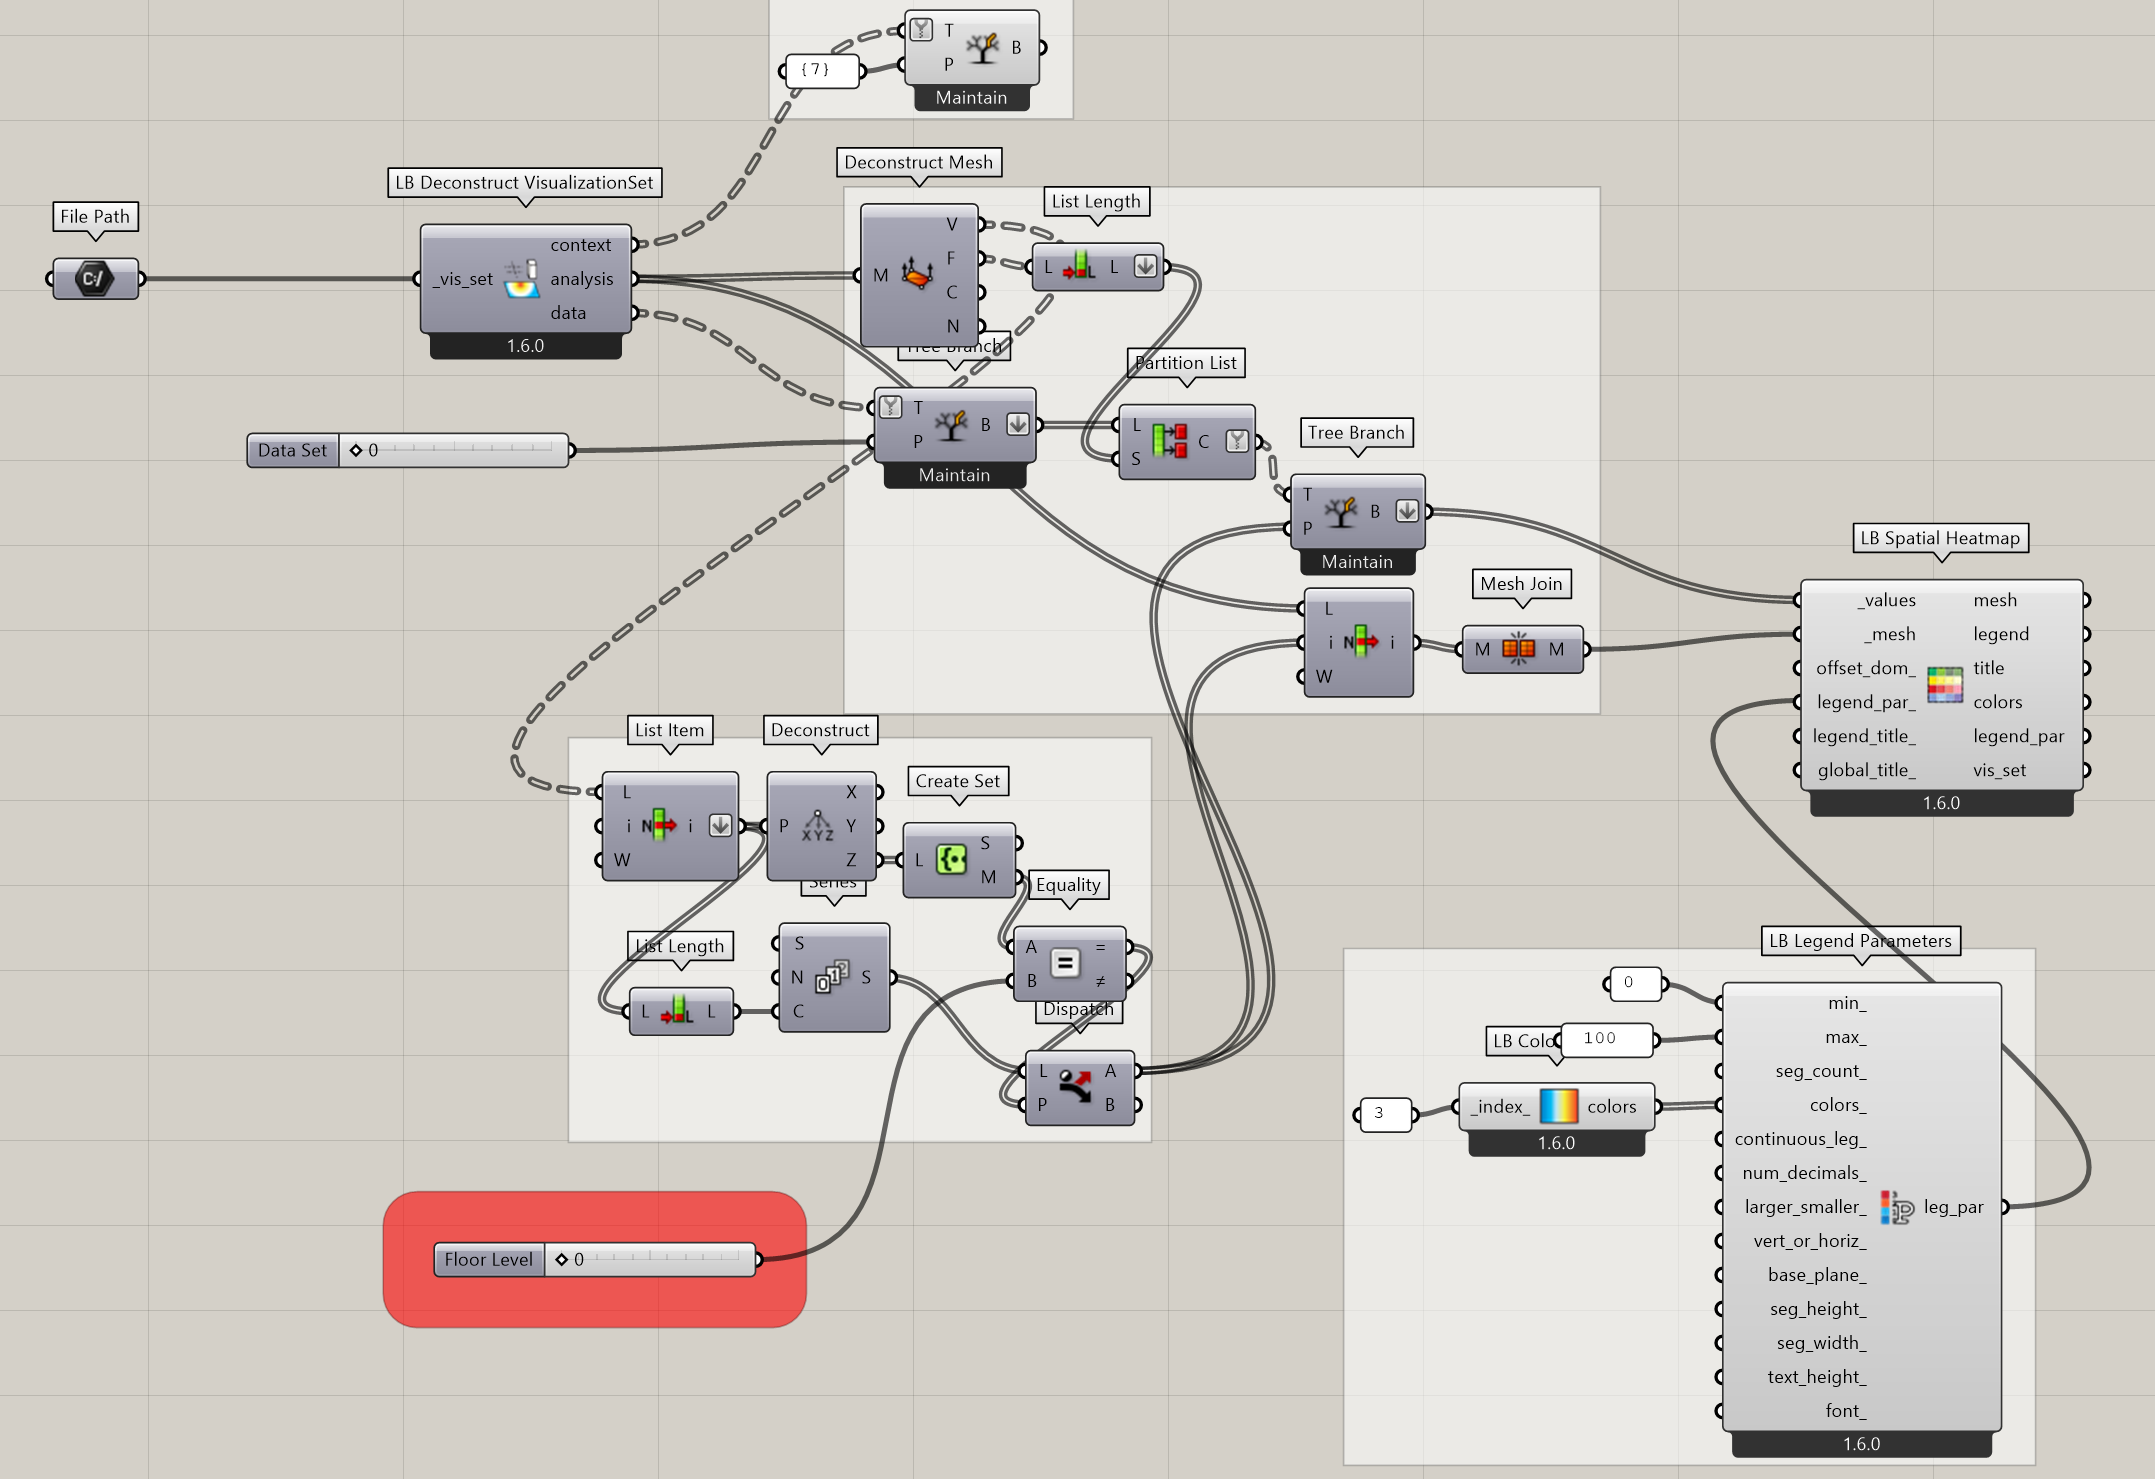
The question of how to group the sensor grids by their floor height or get all of the indices of sensor grids for a certain floor is a different question but, if you have a sample run or file that I can work from, I can show how this can be done in the Grasshopper script.
Hey @chriswmackey, Agreed! But let’s write a separate proposal for this and discuss it more before making any changes. There are at least two improvements request that has come up after the initial release of the visualization sets. This one and the one for separating the metadata (header) from the content. We can address this as its own project. We also need some coordination with Mingbo and Antonello for the Rhino and the Pollination viewer.
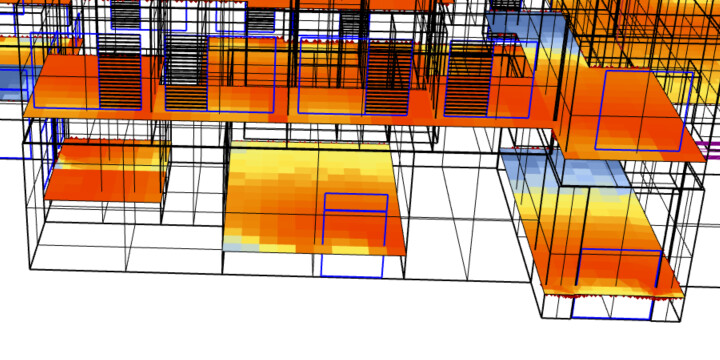
It’s a little more complex than the other script but it can handle scrolling through different data sets (eg. DA, UDI) as well as scrolling through different floor levels.