Hi @mostapha - Just another query on the same topic-recipes & visualization.
I ran a simple parametric simulation with annual daylight recipe (for UDI) (locally and on cloud) in order to see the impact from orientation. And then once I visualize the result through GH plug-in, there was no difference for UDI among those orientations for local run simulation. On the other hand, cloud simulation run provided different results.
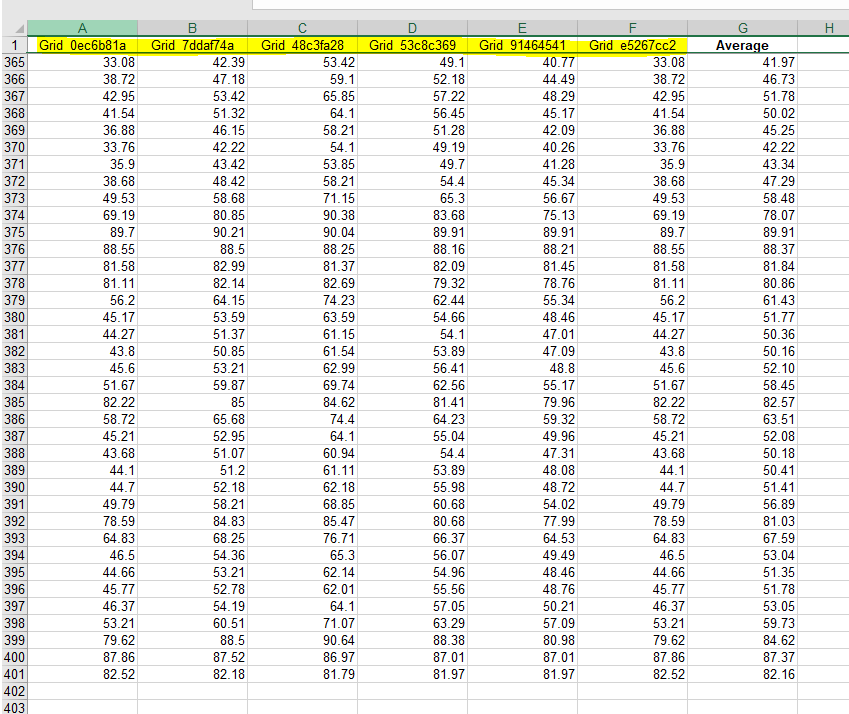
So, when I check the results folder, I can see that UDI figures for each sensor points are different for different orientations as expected. So, I believe this is also something with visualizing an average figure of the results for a single mesh. If this is the case, is there any solution or workaround for this? Otherwise, can you tell me what am I missing here?
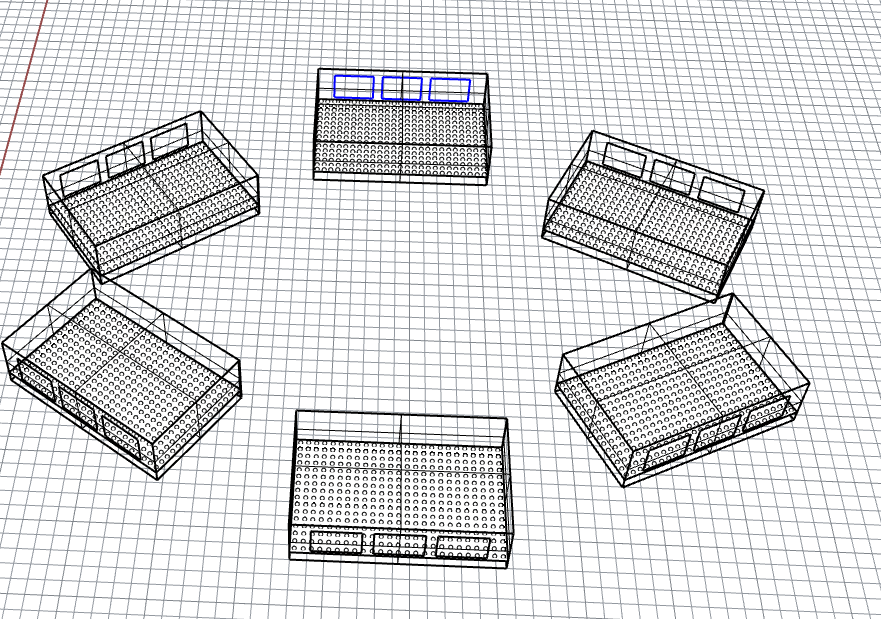
This one is from local run.
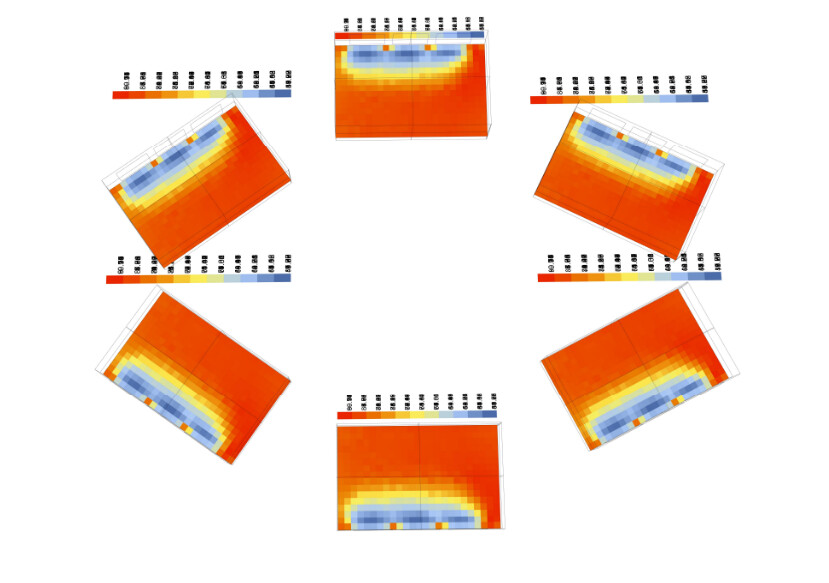
This one is from cloud simulation.
Thanks,
Levent