Thank you for dedicating time to your unofficial role as chief bug officer! I think the best people to help here will be @tyler and @mingbo as they are currently working on some changes to how authentication work with the C# API client. This might be why you had to go through a new email verification process.
With regards to the artifacts creation error:
Is this an error you have managed to reproduce reliably or does occur randomly?
Did it still happen after you went through the email verification process?
Regarding the runs executing slower than with early access, that’s a bit weird given that we’re still in early access Do you mean to say it runs slower than before we implemented account wide limits to the number of parallel CPUs you have access to?
Thanks @antoinedao, I think we haven’t merged any updates to the production server, not sure if this is related to authentication updates. Maybe @tyler might know more about it.
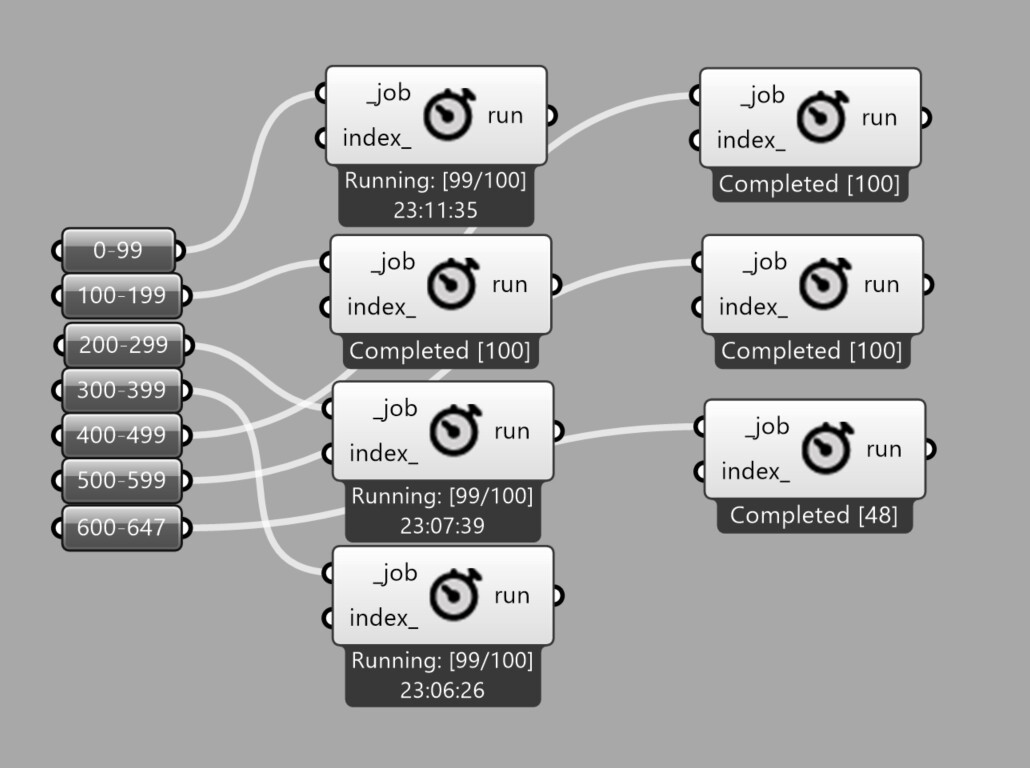
I then sent off runs 0-199 and it worked. So, assuming the one causing the issue would be somewhere between run 200 and 399, I sent off only those runs, but it also went through…So it doesn’t appear to be an issue with the simulation setups, right?
BTW, out of the ones I sent off yesterday in groups of 100, three runs are still going…
I’ve given you access to that project folder - would you mind giving it a look in an hour or so and if something is still running, check whether it’s that error again where you can manually mark runs as completed?
So it’s a reliable bug! That’s super helpful thanks. I’m assuming the error in this case is still: Error calling CreateArtifact: The request timed-out right?
Potential Source of Bug and Solution
I have some thoughts which I will jot down here about potential sources for the bug and what might fix it.
The fact that chunking the job into smaller ones added to the fact that the error indicates something “timing out” indicates to me that either:
Our C# client is overloading our API and causing it to slow down dramatically and not respond in a timely manner
The C# client timeout is too strict
I look at the C# client and the timeout is set to 100s. Looking at the traces for our requests on the backend I can see that the requests that are going through are not exceeding 500ms. It is possible that a few requests are simply bugging out and not returning anything however I would expect to find error logs anywhere along the stack and I cannot find any…
Then I found this issue in the RestSharp repository indicating some odd timeout behaviour when making many concurrent requests. It seems like our timeout might be dictated not by the time the requests has started and then been responded to but instead the timeout is set from the time the async request was scheduled on the multi-threaded app and when the response was received.
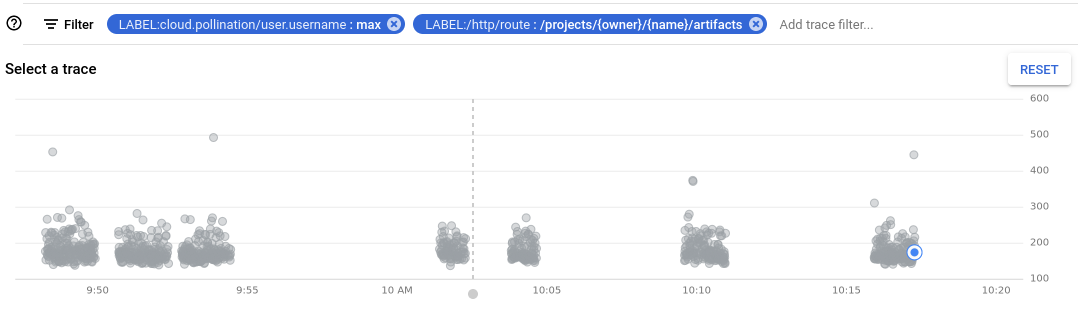
As such if we were to schedule all the “create artifact” requests at the same time, and then iterate through them in an async manner over more than 100s we could expect to receive a time-out error from the client. I decided to check this theory against the API calls made by @Max by checking if the duration from first CreateArtifact request to the last had an impact on which ones scheduled a job.
The image below is a bit dense so bear with me. I have linked a series of “CreateArtifact” API calls to a “Create Job” API call with a blue line. The chunks denoted in red are those for which no job was created (and therefore an error was thrown at some point in the process.
The two jobs that have failed to be scheduled both took longer than 100s to create all their artifacts. My conclusion is that the RestSharp library has a strange understanding of what a request timeout means in an async context. We can correct this by either:
Increasing the default Timeout from 100s to a much bigger number
Increasing the DefaultConnectionLimit to increase the actual concurrency of the API calls
@mingbo and @tyler let me know what you think of these observations.
Hanging Runs
I will fix this for you manually just now @max. It looks like they have completed succesfully but again, for some reason, have not been updated on our end…
On a positive note it looks like your three non-updated runs are the only ones on the platform at the moment. This is a small victory on our end
This seems like a good direction to me. I will hopefully have some time to set up the GH client on my machine today or tomorrow and try to replicate this. I’ve still been meaning to get back to @compdesignernz about the last time that this happened, but have been swamped with other issues.
So I tried to recreate this directly by introducing a delay greater than or equal to the 100s timeout before the upload tasks and wasn’t able to recreate the error. The REST client could still be the culprit, it just means that whatever is happening requires a bit more digging than “if a request is scheduled for more than the timeout, it fails.”
I did notice that we aren’t actually uploading files asynchronously, so it’s possible that a long-running upload request could block the task pool. That’s a simple fix.
In addition, I think we can increase the timeout, increase the number of concurrent connections, and add better error handling to track down what’s going wrong.
This also seems to be a slightly different issue than what @compdesignernz ran into where the jobs were created, but the artifacts were not.
I’ll make the changes that I can in the next couple days and hopefully that will unblock you from running large jobs @Max while we look into improving the artifact upload from Grasshopper.
I was able to reproduce this bug last week when creating a parametric job of a model with around 784 versions where each model was ~1.4MB. I’ve merged a fix to our C# SDK that raises the timeout to 3x what it was, adds a way for you to raise it even more if necessary, as well as some other minor fixes around the artifact upload and better logging so that we can more easily track down any future issues.
This fix is available in versions at or above v0.118.1 of the Rhino/Grasshopper plugins.
Please let us know if this fixes the issue you were having or if it still remains!
@tyler, have you uploaded this version yet? The latest version of the GH plug-in on pollination.cloud appears to be 0.102.1 - I have tried with this and still run into the same error
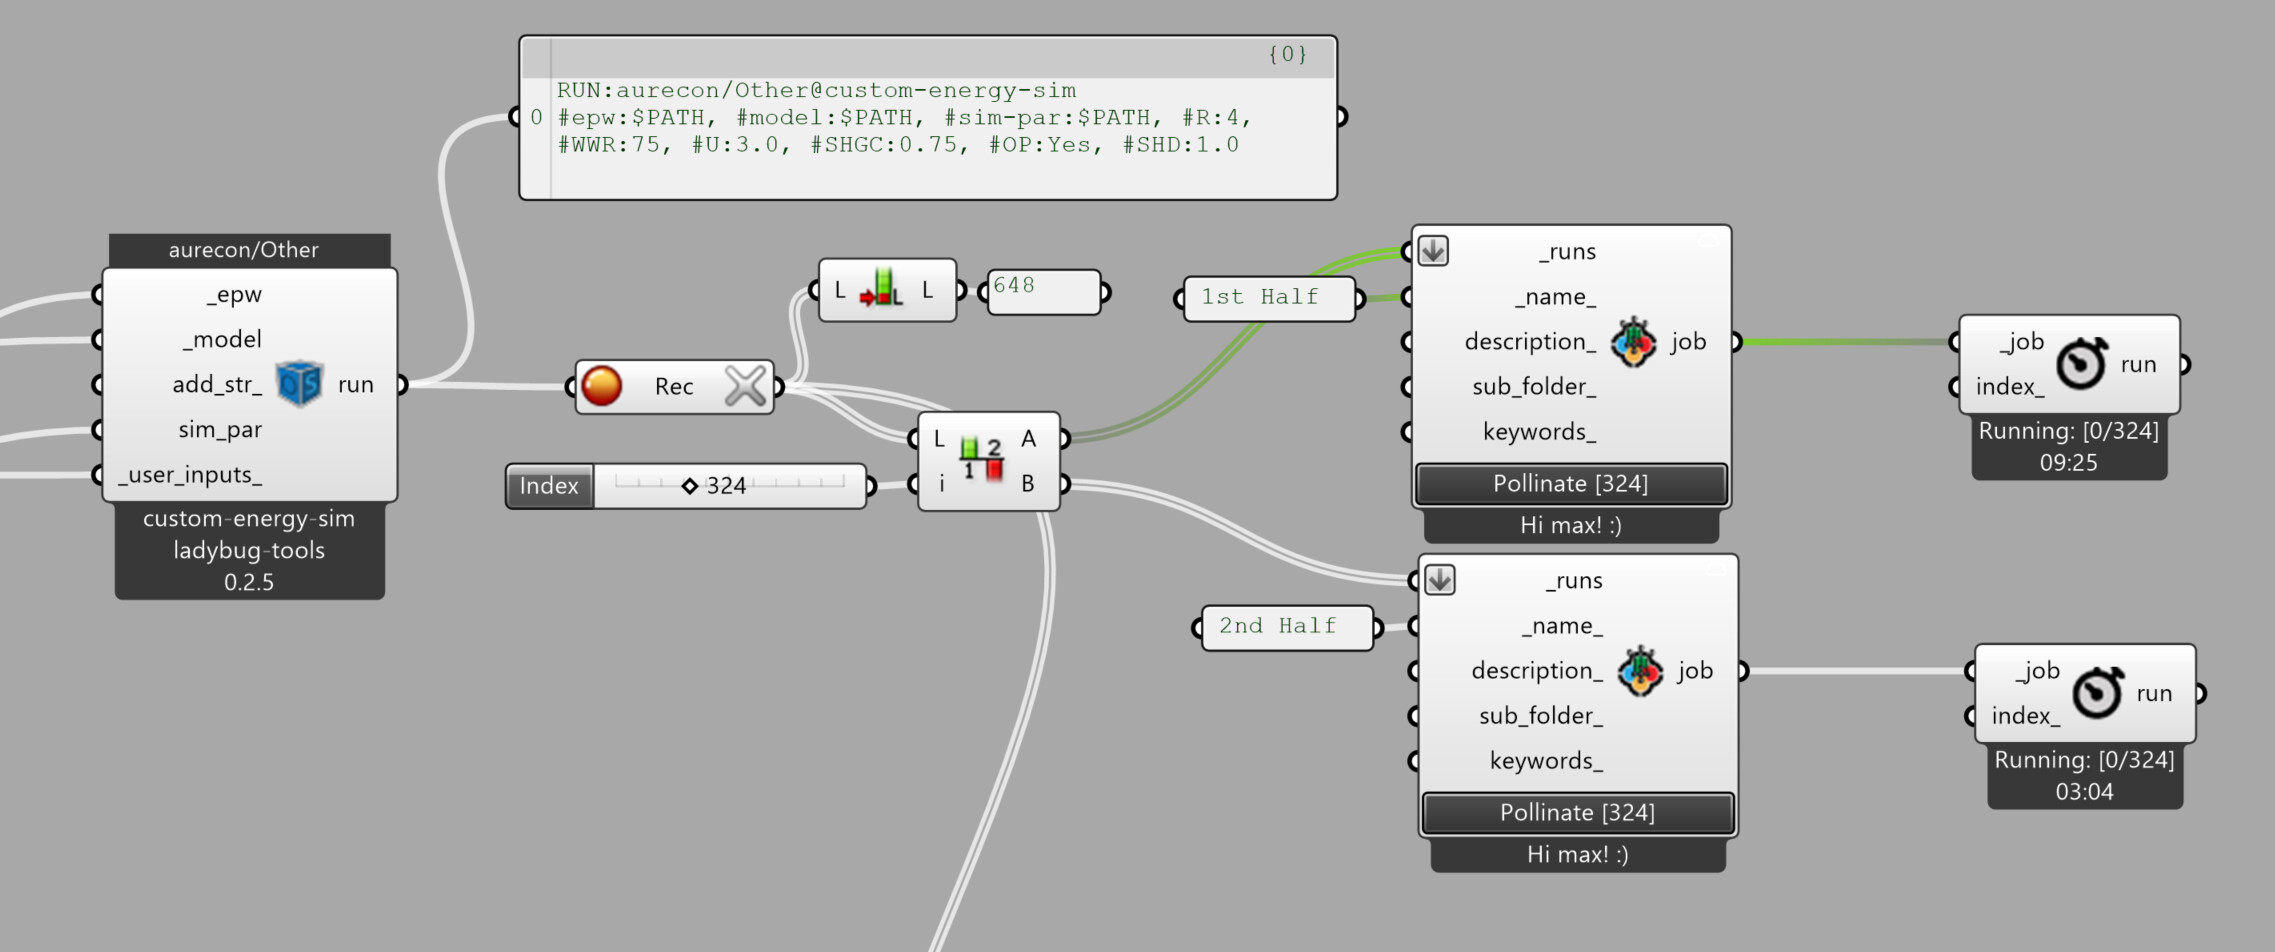
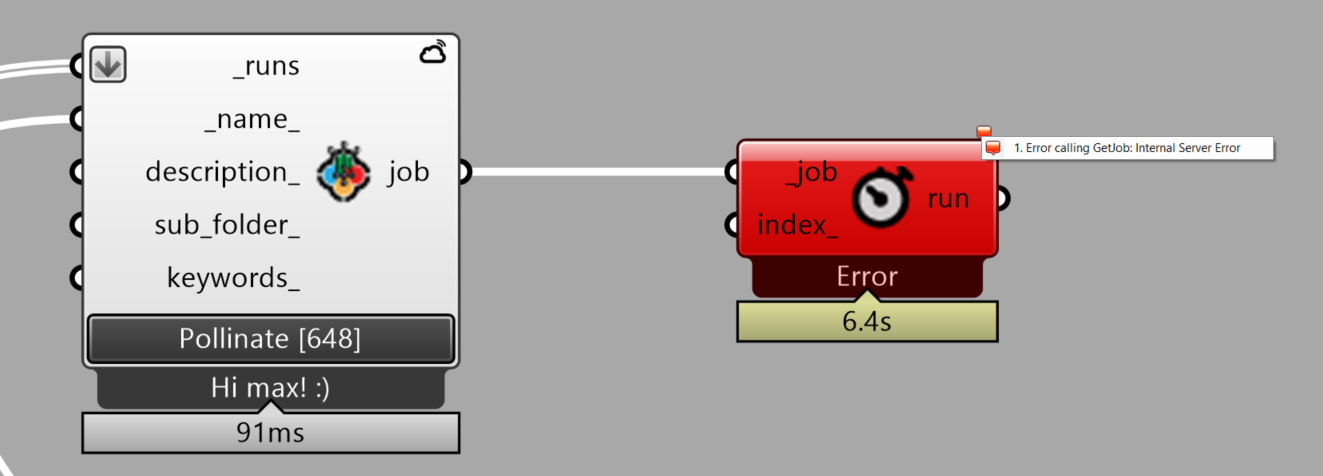
@tyler, @antoinedao, I can confirm that with the latest version, I can now send off all 648 of my runs at once. Thanks!
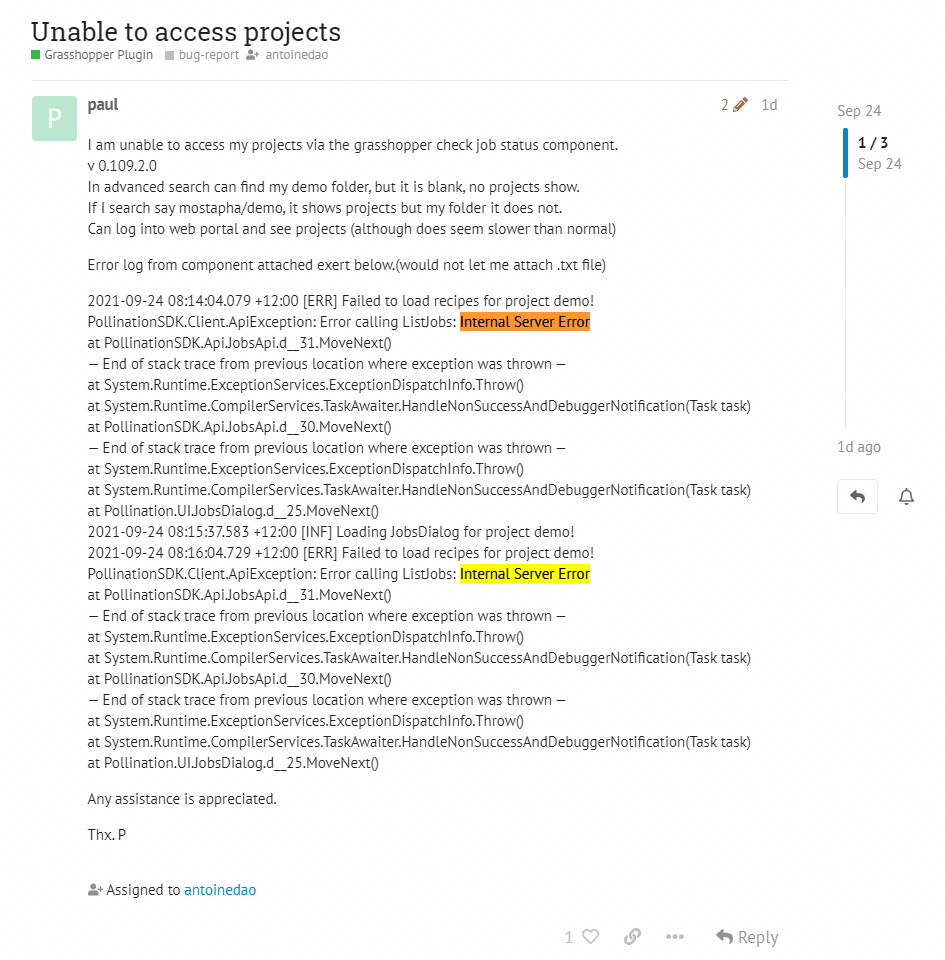
However, I still can’t access the job on the web app (this time I sent it through my own public demo project), because of the problem that me and Paul have posted about.
This is something that @antoinedao had solved back in May, but it is also an error that shows up in the log that Paul posted, so I assume these issues are connected:
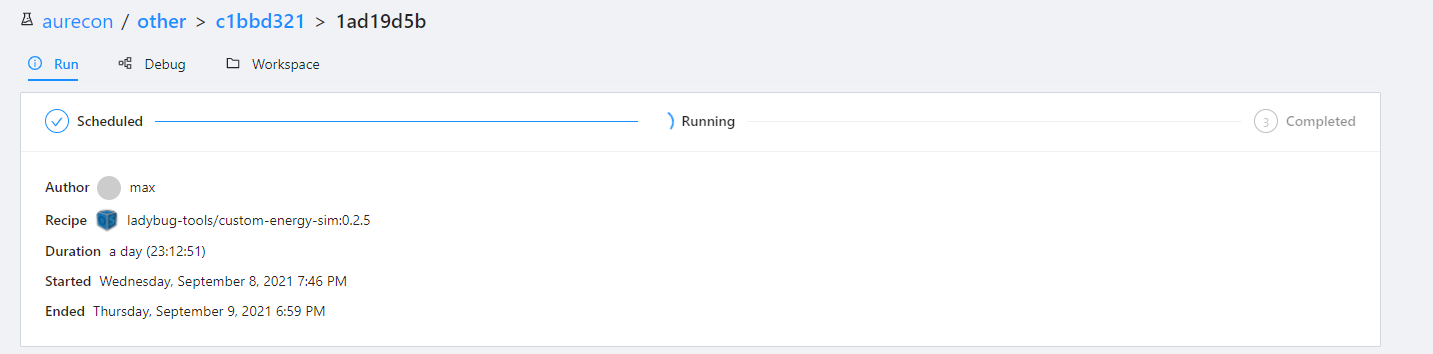
It seems to be working, however it looks like there might be that ‘hanging’ error again. Here is the job: CLOUD:max/demo/4ffbd3de-e719-4d88-952d-772a6afaf55c
It consists of 648 runs that each take about 22 seconds to run locally, however it has now been running for 1.5h on Pollination and so far has completed 615, and has been stuck at 615 for a suspiciously long time period. Could you please check this?
I know that there are no errors in the remaining runs because I have also run them all locally successfully.
Seems we’re not rid of this cursed update bug after all… I manually updated your job just now so you can access your results. We are carrying out some in depth refactoring work/research to figure out the best way to get rid of this run status update bug that has been plaguing the platform when under heavy use. I want to thank you again for being patient with us here and for helping us uncover as many bugs as we can before going GA!

 I think the best people to help here will be @tyler and @mingbo as they are currently working on some changes to how authentication work with the C# API client. This might be why you had to go through a new email verification process.
 Do you mean to say it runs slower than before we implemented account wide limits to the number of parallel CPUs you have access to?