Thanks to Ladybug Tools, we are able to visualize daylight analysis results quickly. However, in terms of demonstrating compliance with the code, we may need to present daylight analysis results for key metrics. To my understanding, it is possible to get a single UDI/DA value for each sensor point through post processing.
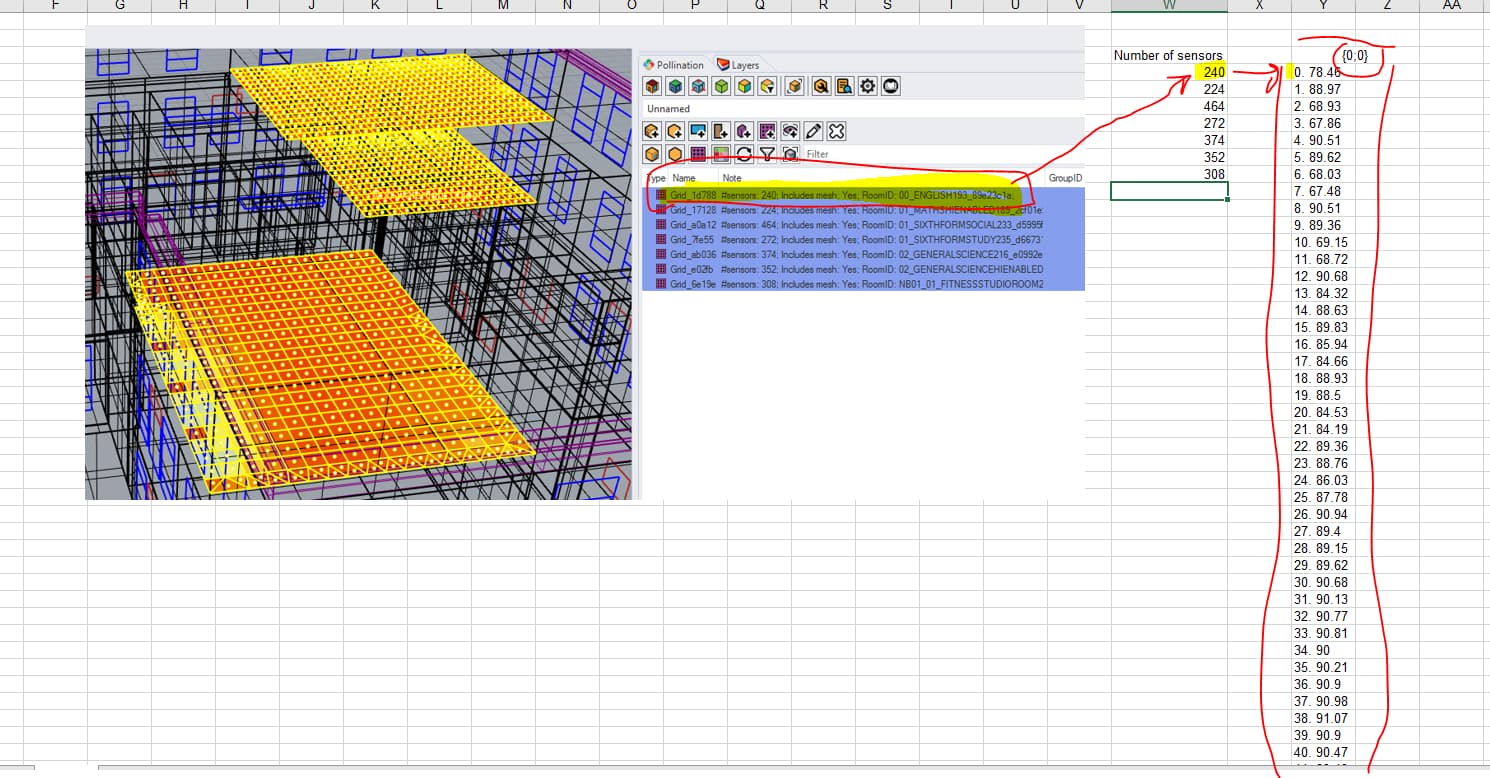
For example, if I want to get a single UDI value for English 193 classroom space, I can get an average of 240 sensor points value to make it work. However, I m almost sure that this could be automated through LBT components. Any direction to start?
Very good question! Since we bake the whole visualization set as a single mesh we can’t extract the space by space numbers.
Meanwhile, you can also use the solution that I suggested in the other topic to get the average for each grid directly from the Pollination run. There is one branch per sensor grid in the model.
@chriswmackey, @mikkel, and @mingbo this is something to think about. We have the option to create a different AnalysisGeometry for each input sensor grid and use the :: notion to group them in the viewer. That should allow up to bake them similarly to how they have been submitted to the cloud.
Thanks, @mostapha . That’s a good point but this satement is not 100% correct, at least not within the .vsf file:
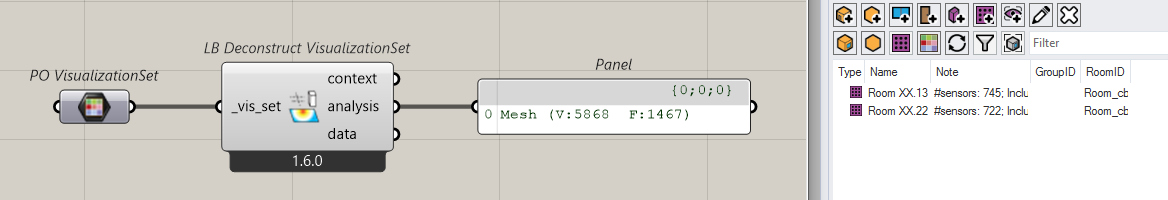
It’s true that the values for each metric are flattened into a single list but each SesnorGrid still has an individual Mesh3D in the AnalysisGeometry.geometry. So you could essentially use the number of faces in each mesh to “unflatten” (or partition) the values.
This should be relatively straightforward with the new “LB Deconstruct VisualizationSet” component that I added to LBT-Grasshopper and you can get with the LB Versioner now (you’d probably just need a few native Grasshopper components to post-process the data). But plugging the .vsf file into the “LB Deconstruct VisualizationSet” component should give you the basics of what you need (let me know if you want a sample).
And, yes, we should still add the option to export each sensor grid to a separate AnalysisGeometry at some point.
Thank you. That’s correct for the .vsf file but that won’t work for the Rhino plugin. The Rhino plugin merges all the meshes together into a single mesh.
We can discuss the best practices for how we create the visualization sets together for the recipes separately. I will write a separate post on Basecamp.