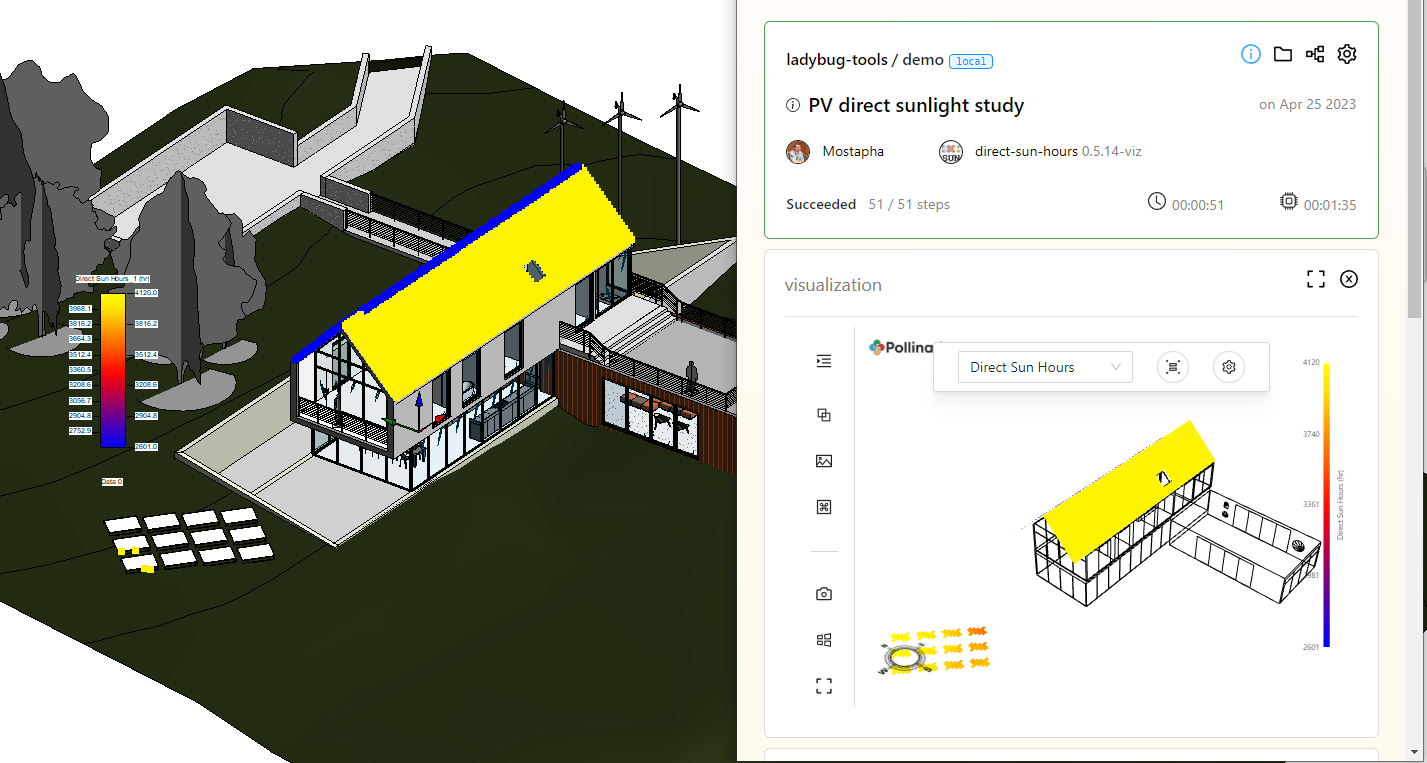
The latest version of the Revit plugin comes with a panel that can be used to schedule simulations, access previous simulations, and visualize the results.
The new version also comes with many more options for creating sensor grids beyond the option of creating them for each room. This option allows you to run facade studies or run an irradiance study on the ground or the PV panels.
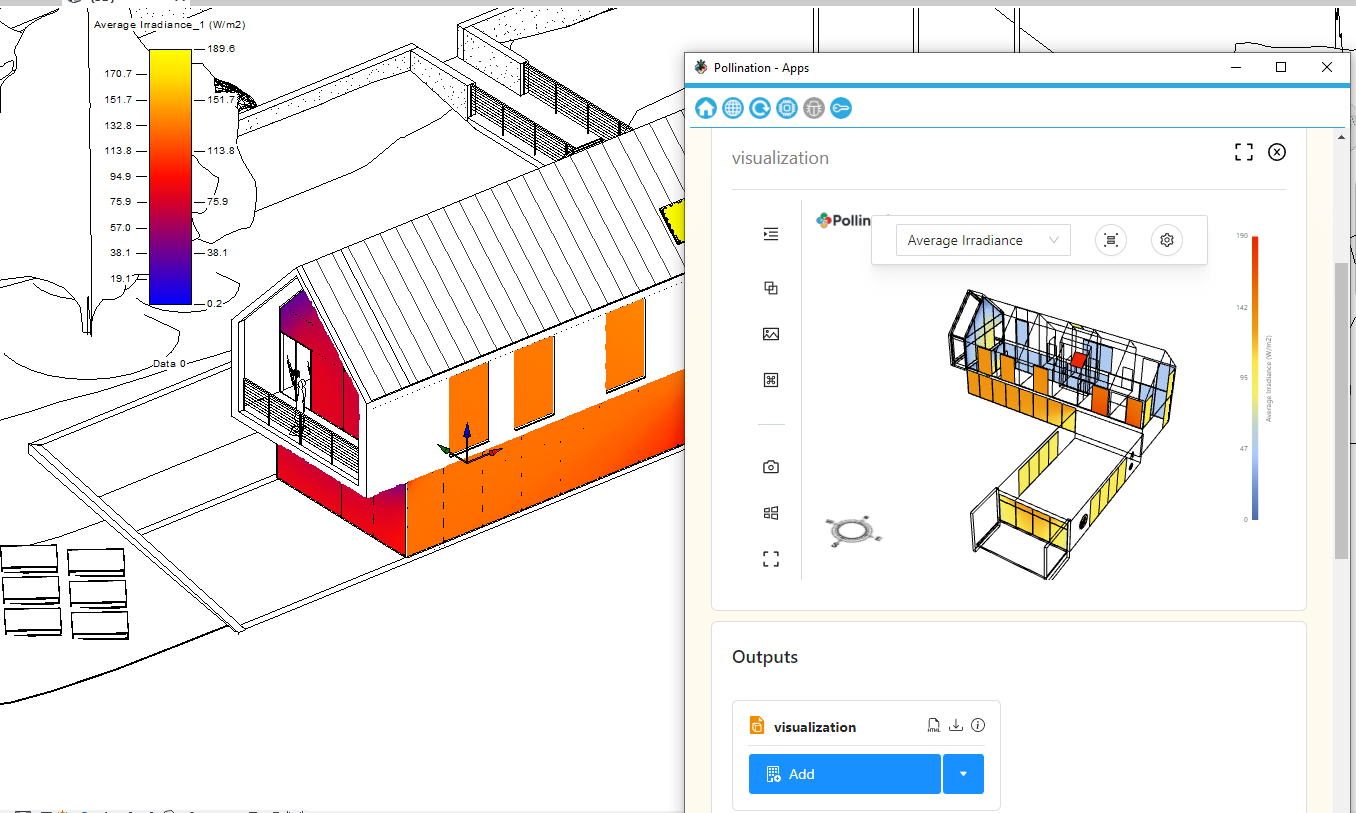
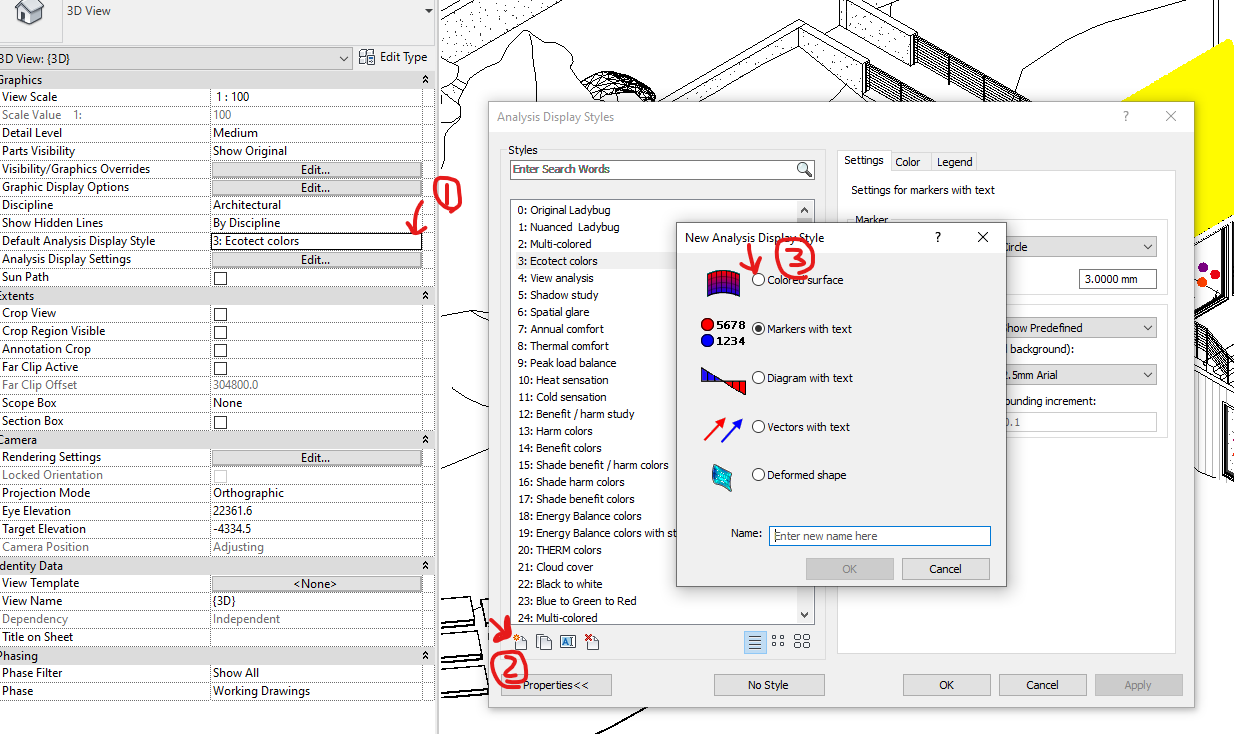
There are currently two main limitations that are both related to how Revit’s Analysis Display and its Settings work:
You cannot edit the minimum and maximum values of the legend. These values are read-only in Revit. You can use the web viewer or the stand-alone HTML file to change the legend as needed.
Revit doesn’t save the Analysis Display as part of the document. That means that you have to load the results from the Pollination panel every time you open Revit and you want to visualize it. We are working on this item to find a solution to save the results to the Revit model so it can be loaded automatically when you open the view.
We are looking forward to hearing your thoughts, and feedback!
Great work! One question. If we analyse something in revit plugin on pollination web, can we open the same task done on the web in rhino enviroment for post processing?
Yes. You can do that. You can even go from Revit to Rhino to Grasshopper and visualize the results back to Revit! You can also do the same when running the studies locally.
Beautiful work guys I love the direction this is headed!
I have 4 clarifying questions/feature requests
Would it be possible to add a field that tells you how many CPU’s you have on your local machine? Just a small and less important feature, but I sometimes work on multiple different machines with remote access, and the CPU count varies from one machine to another. So that feature would be handy for such cases, if you wish to run the simulation locally
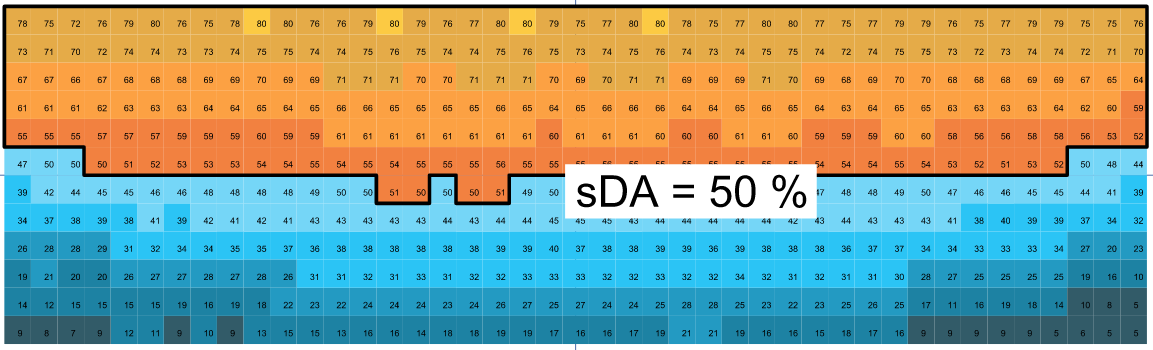
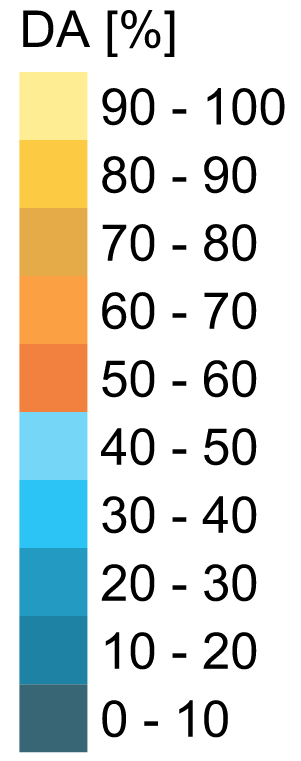
Is it possible to choose what colour scheme to use, when you visualize results in Revit? Lately I’ve been using a categorized legend with this colour scheme, as this is much easier to understand for contractors and developers that aren’t proficient in daylight metrics. In the picture below I’ve added a “50%-line” but that’s not even necessary with this legend, as the contrast from orange to blue makes it very clear to see, what part of the room has DA >= 50%
Is it possible to visualize the absolute results e.g. sDA, UDI_a, DF_avg, etc. in some way directly in Revit
Would it be possible to add custom schedules? You know that I work with EN17037, so being able to choose the daylit hours rather than the LM-83 occupancy schedule would be much appreciated
There actually is a separate recipe for this. It runs the same way as annual-daylight, and uses the epw file to calculate the schedule using this command. The only difference is the metrics. It has been a while since I last updated the recipe, but I can do that and push it to production.
Awesome Mikkel, thanks The code looks much more reliable than having create a schedule manually
How do I get access to the recipe? I can’t find it under recipes.
Great questions as usual. @mikkel responded to the last one. I’ll try to answer to the rest of them.
We can probably set the default to the number of available CPUs - 1. That’s what we do in Ladybug Tools. Something for @antonellodinunzio to check. It should be possible and I agree it is very nice to have.
Yes. We use Revit’s Analysis Display object and you can create your own. We are creating a few based on the one for Ladybug Tools.
We have an open topic for this to visualize the results per room/space in Revit. My understanding is that it will be possible but we have to figure out the best way to implement them efficiently with a similar schema.
That is because the recipe was never pushed to production in the first place, which means that you cannot find the old versions either. When it has been updated to use the VisualizationSet I will push it to Pollination, and let you know.
That is very nice. Being able to make your own colour legend is always a plus
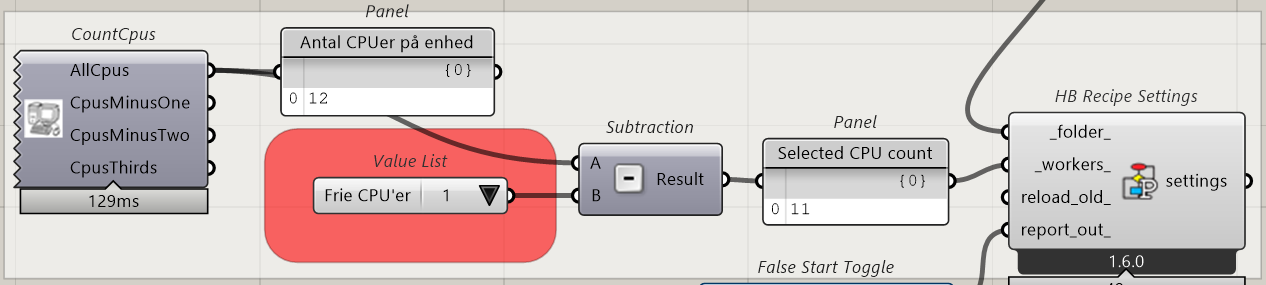
I actually have a proposal for a different approach. When working on a local machine, I am actually more interested in knowing how many CPU’s are still available while running the simulation. If I’m just gonna work in word while the simulation is running, having 1 or 2 CPU avaible is fine, but if I’m working in another Revit model, I might need 6 CPU’s, etc. So choosing how many CPU are left has greater value than choosing how many CPU’s should be used on the simulation.
This is what I do manually in my current script.
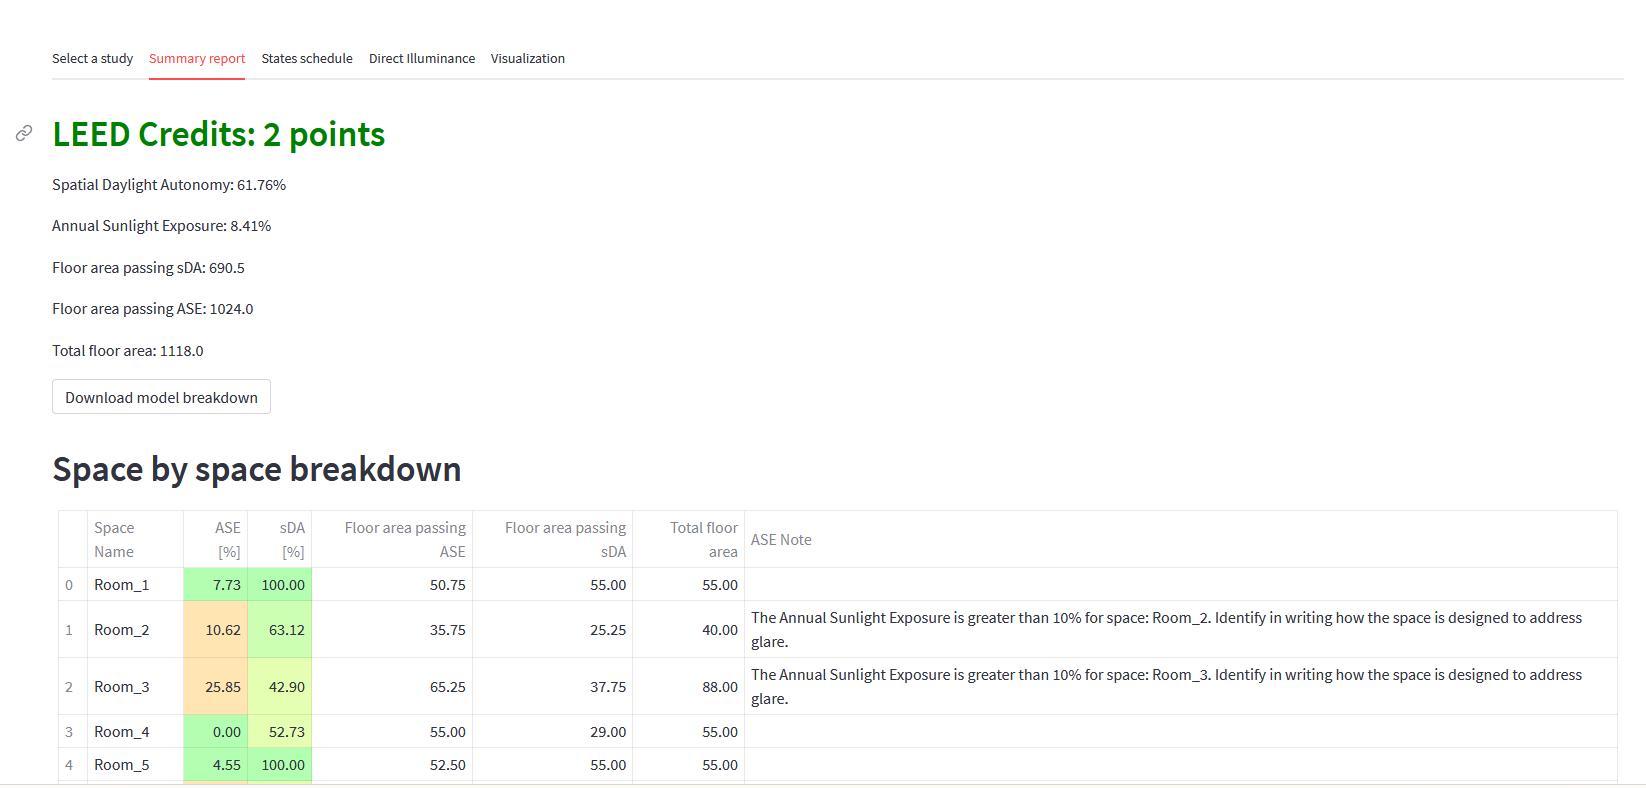
Looking forward to hear what you come up with Displaying the spatial results in a table rather than displaying the results directly on the floor plan is also perfectly fine, I’d say.
Have you guys had a chance to look into a way to add exterior wall surfaces to daylight models as we discussed early? As a short recap, if you building is selfshading, which it is in all cases other than square buildings, the reflection of the exterior side of the external wall has a big influence. And in most cases, the reflection of exterior wall surfaces are substantially lower than for interior wall surfaces. So I think that this feature is quite important
Thanks! That can work. In any case, you will always be able to change the value. We only set the initial default value.
Have you seen the apps for the LEED recipes? Try the sample project. That is very straightforward to do. We should probably start writing more apps for other daylight recipes so you can use them for analytics.
Yes. Our conclusion was that we should add a new export routine that exports the model as a mesh-based geometry that can include all those details. Our current approach is optimized for energy models which is arguably much harder to get right. Now it is the time to provide other pathways to get models that can only be used for daylight simulation.
The recipe is on Pollination. Here is a sample run. Ideally I wanted to add at least one more visualization to it but it does not work for now. In its current state it will give you the usual annual-daylight visualization and metrics with the daylight hours (4380 hours) schedule.