Thanks for the welcome. The project is looking exciting.
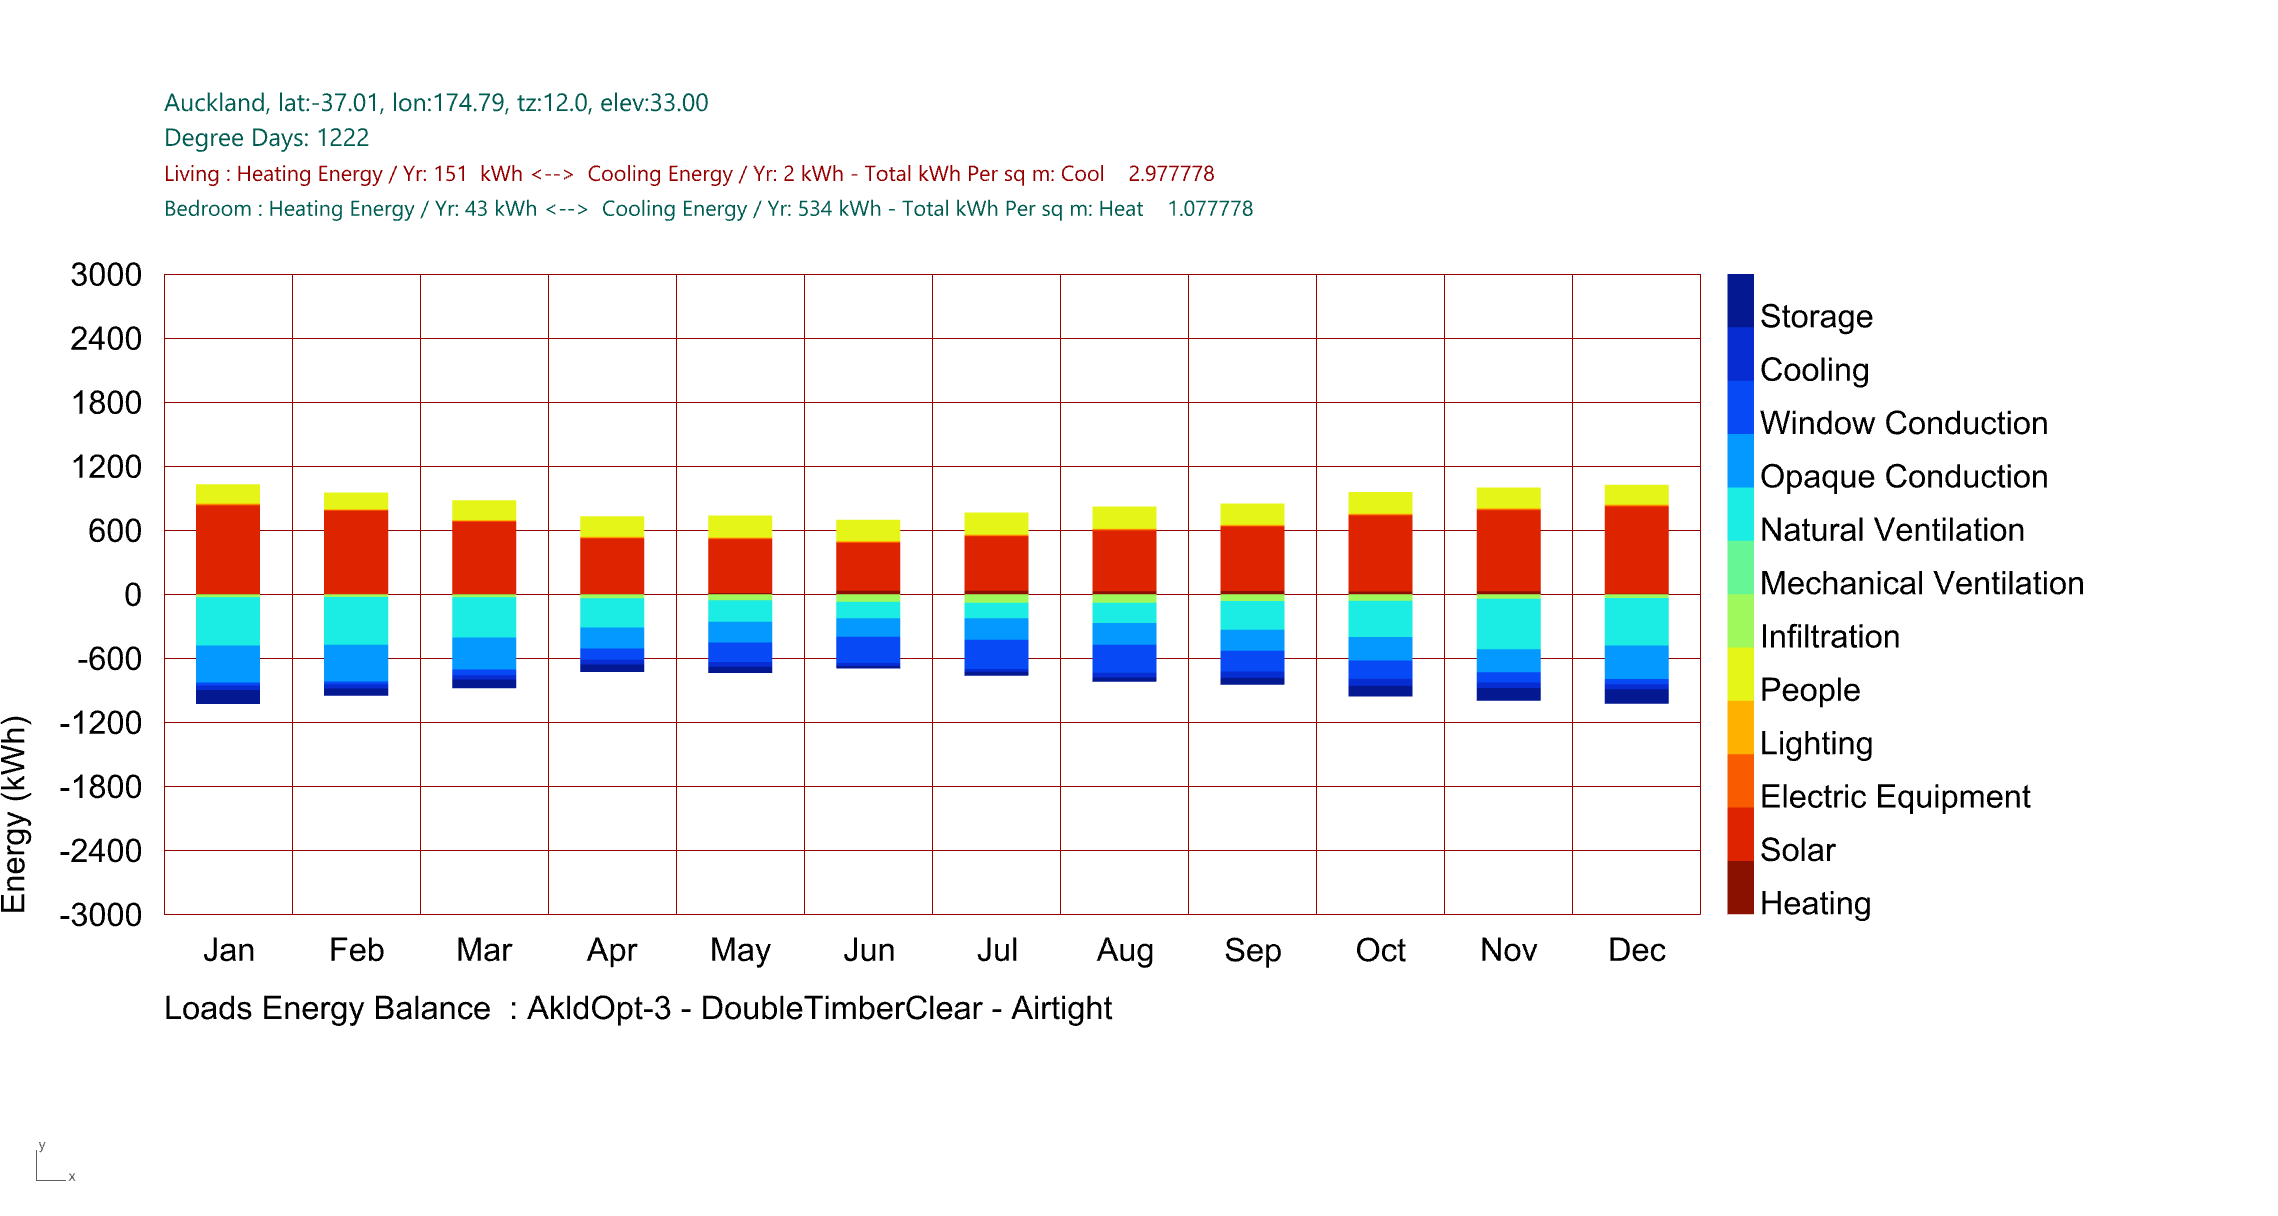
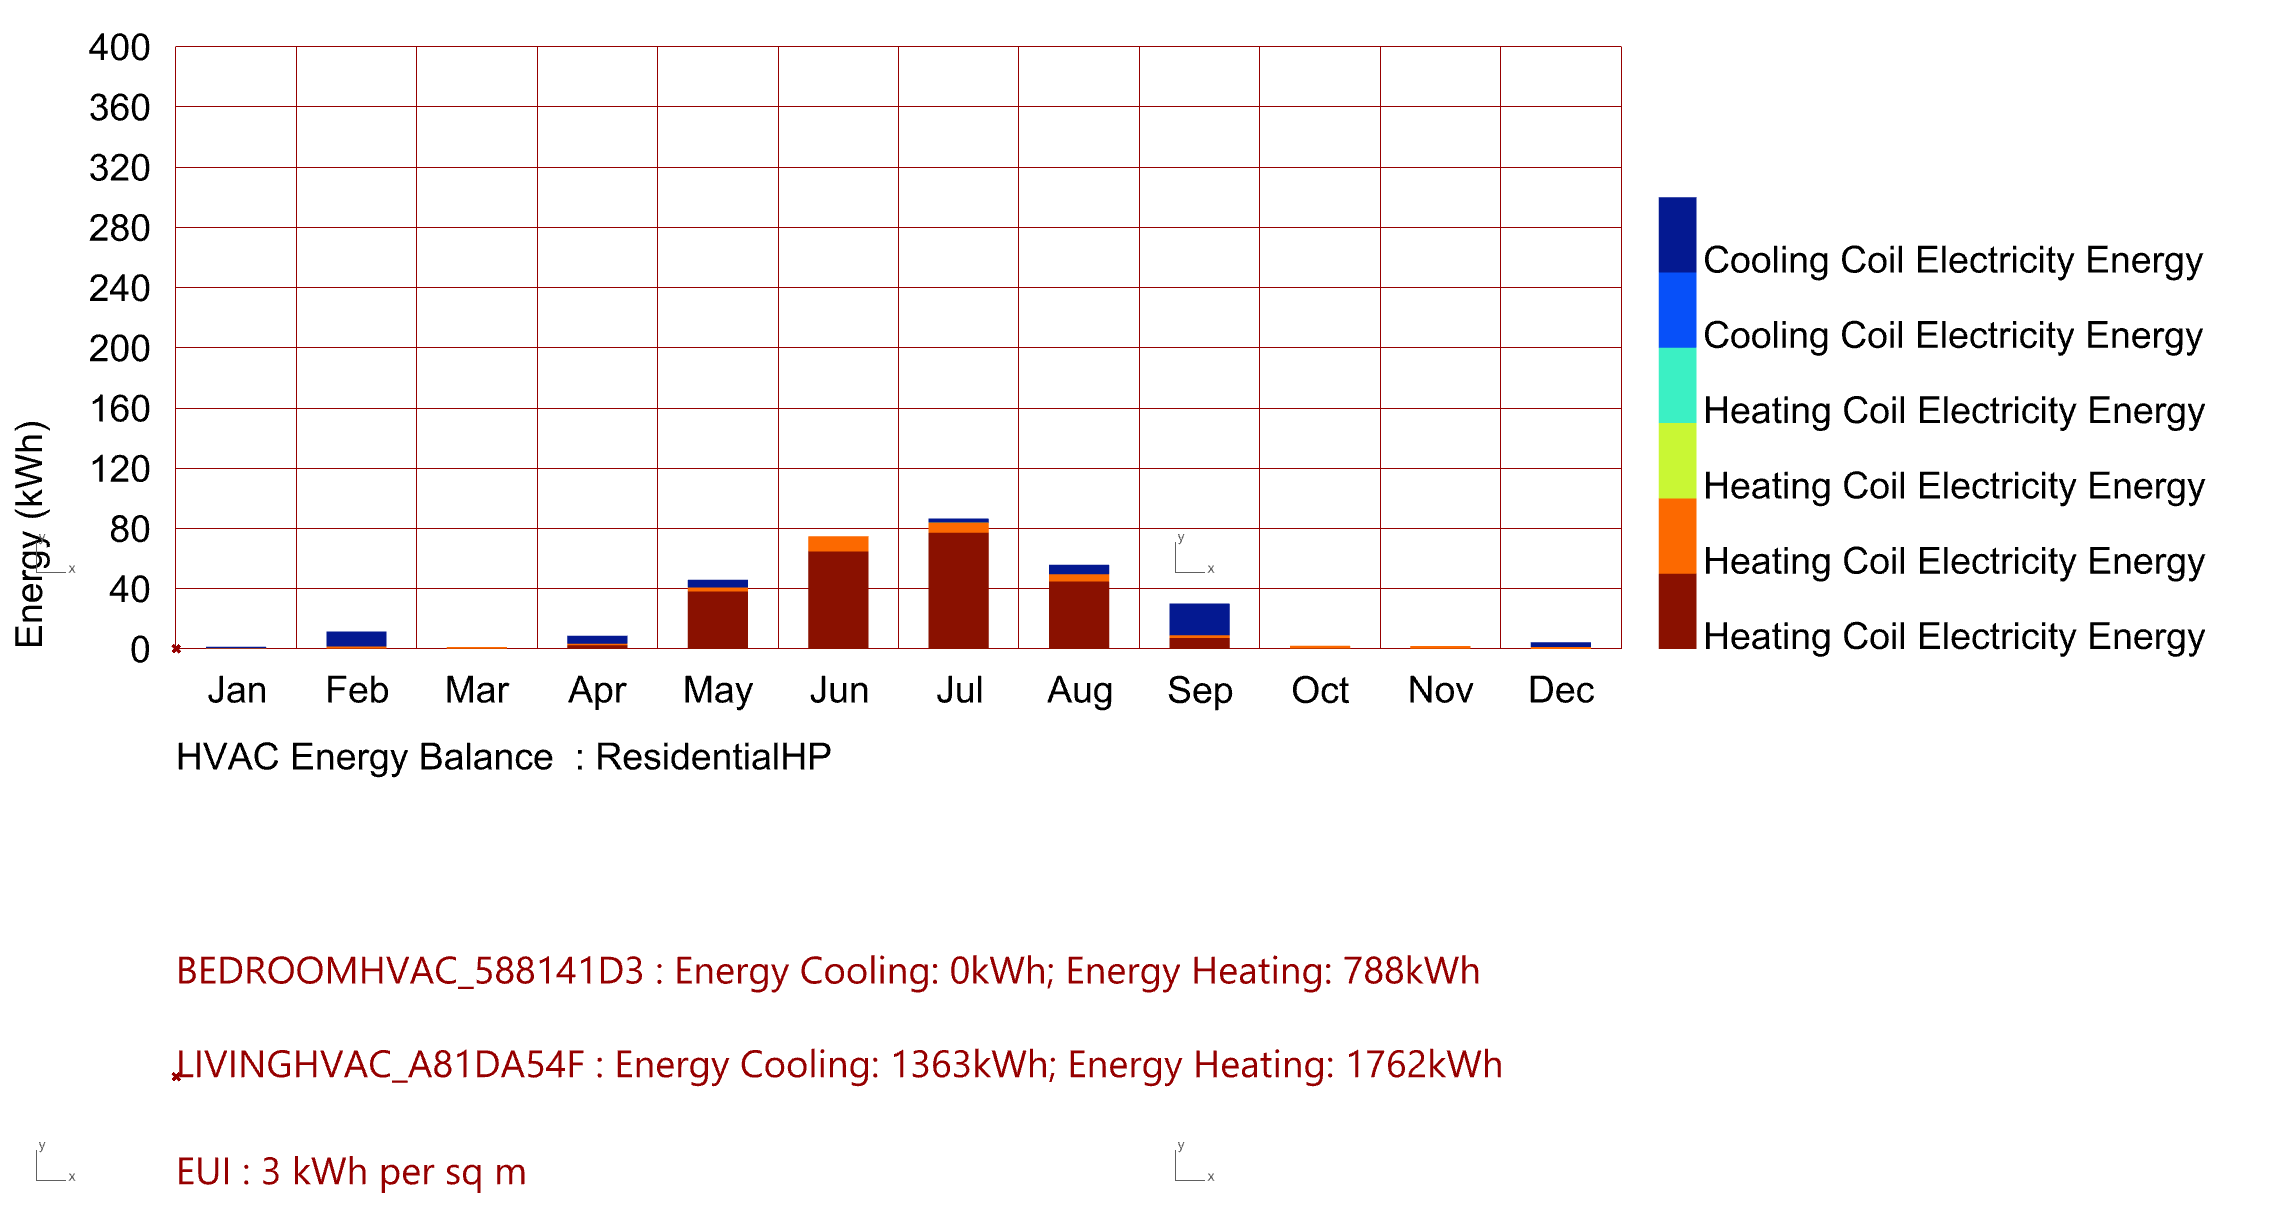
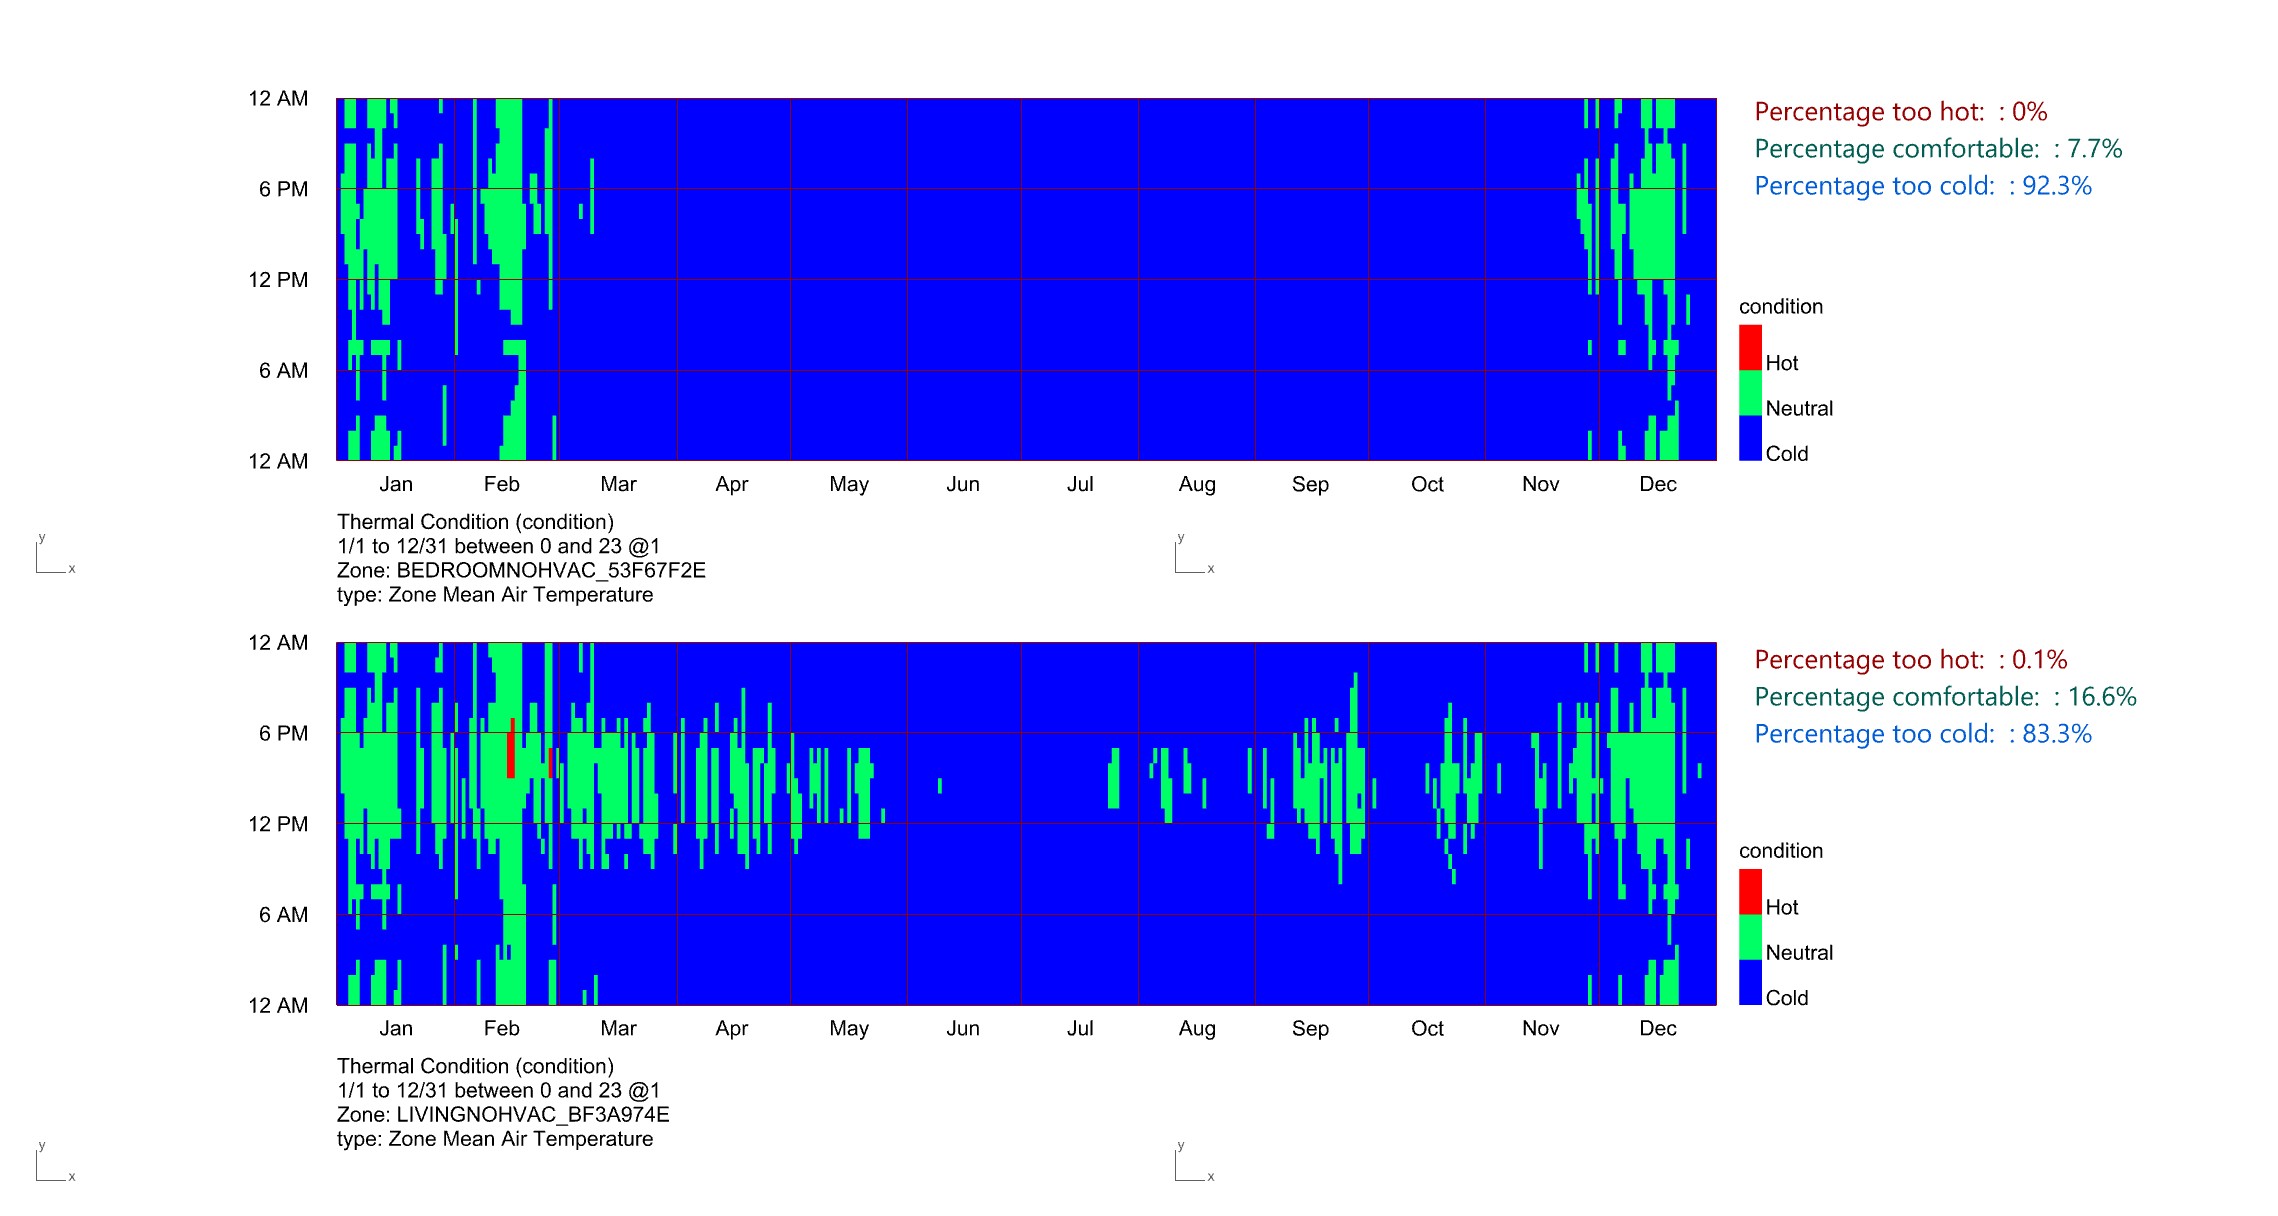
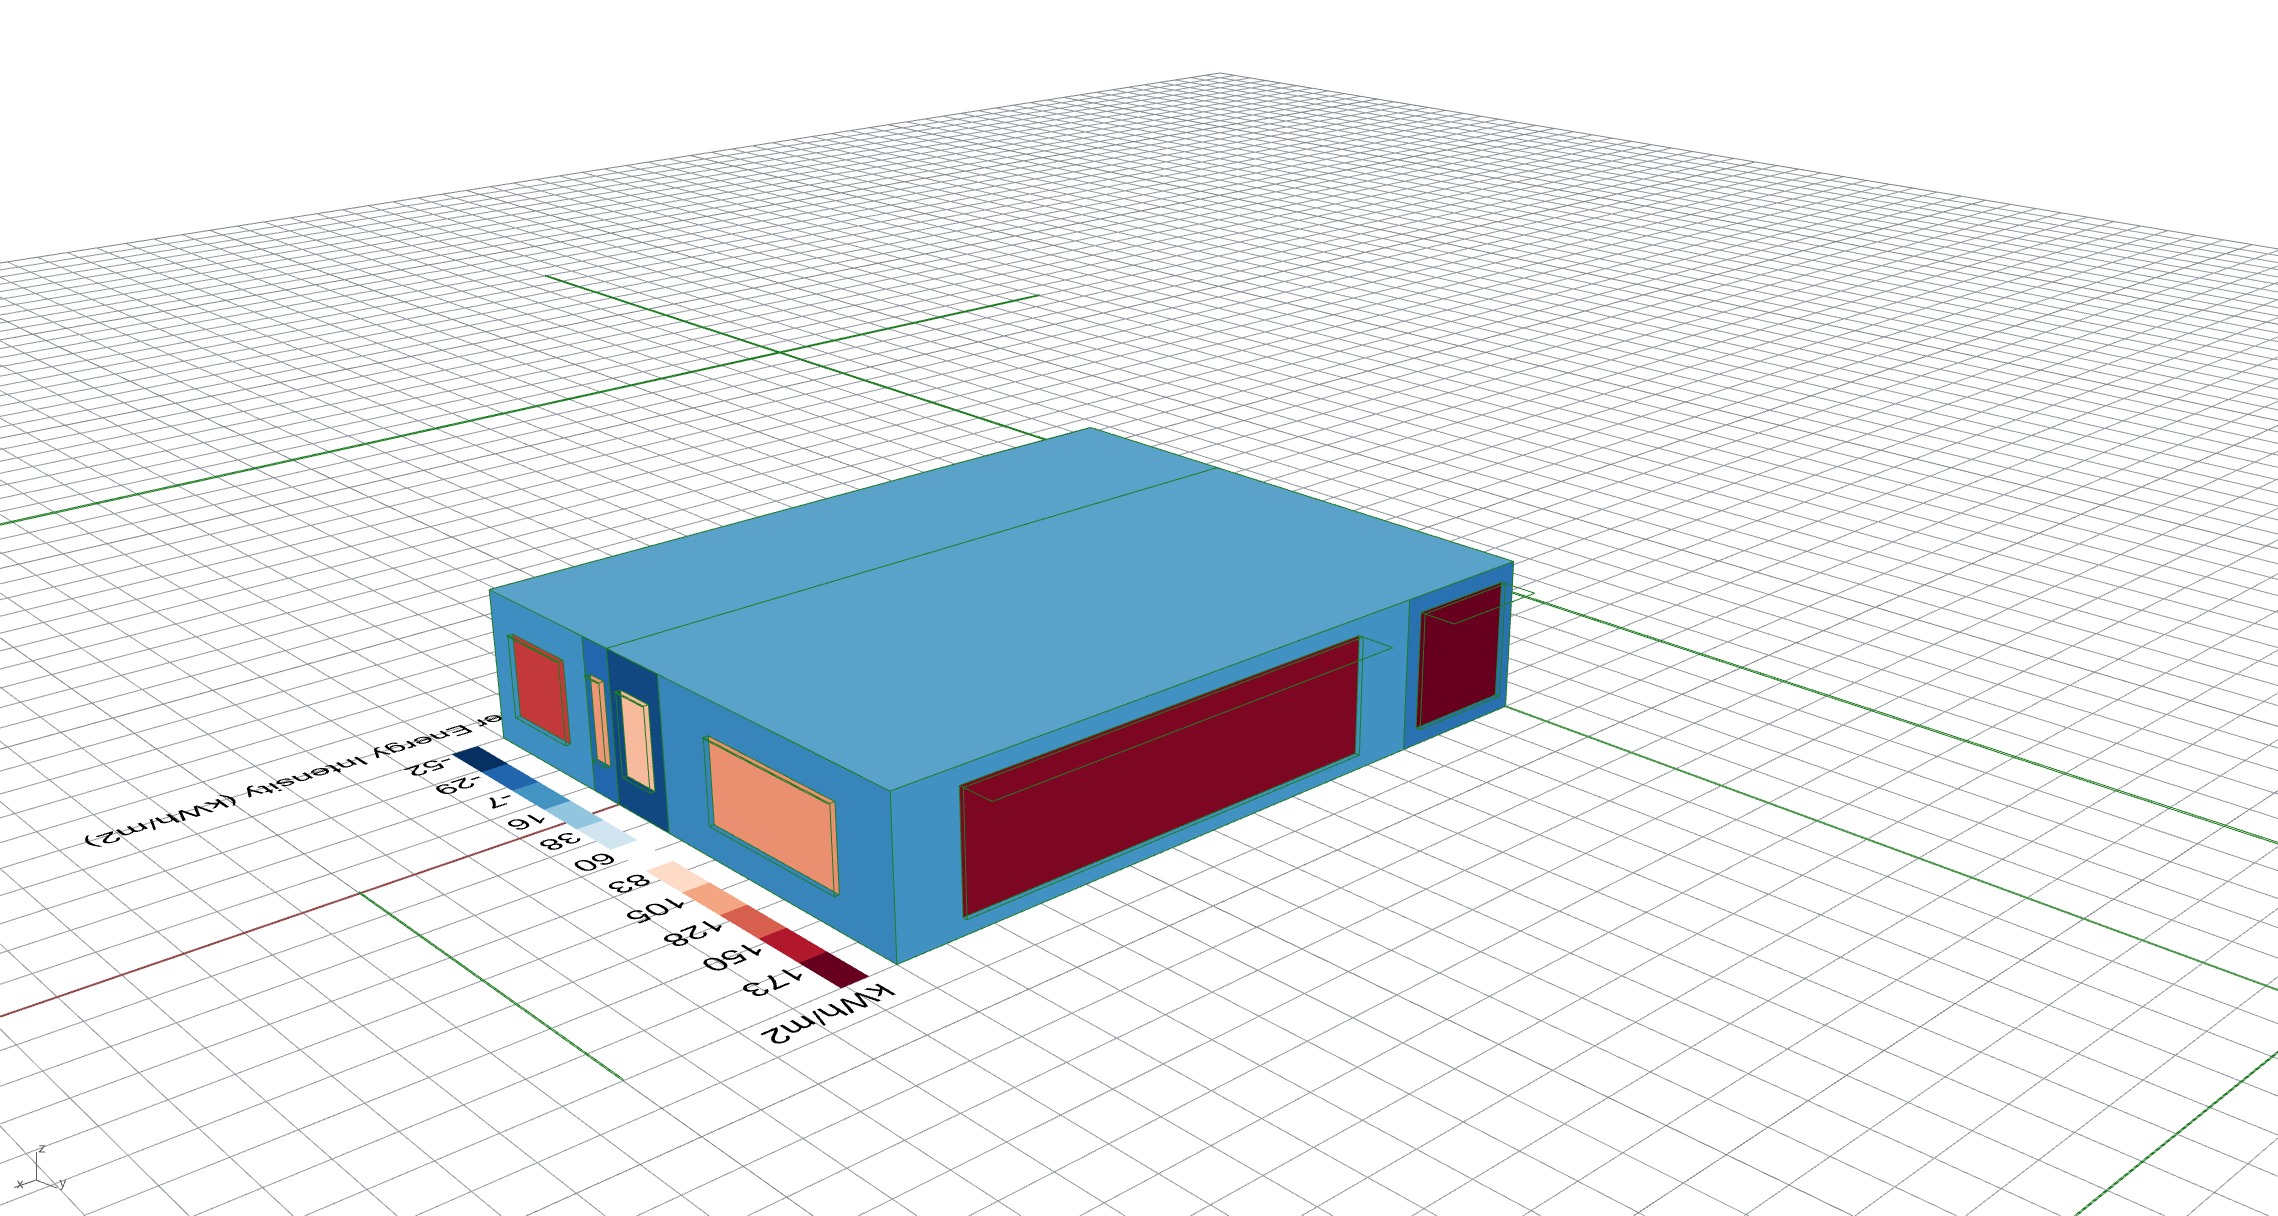
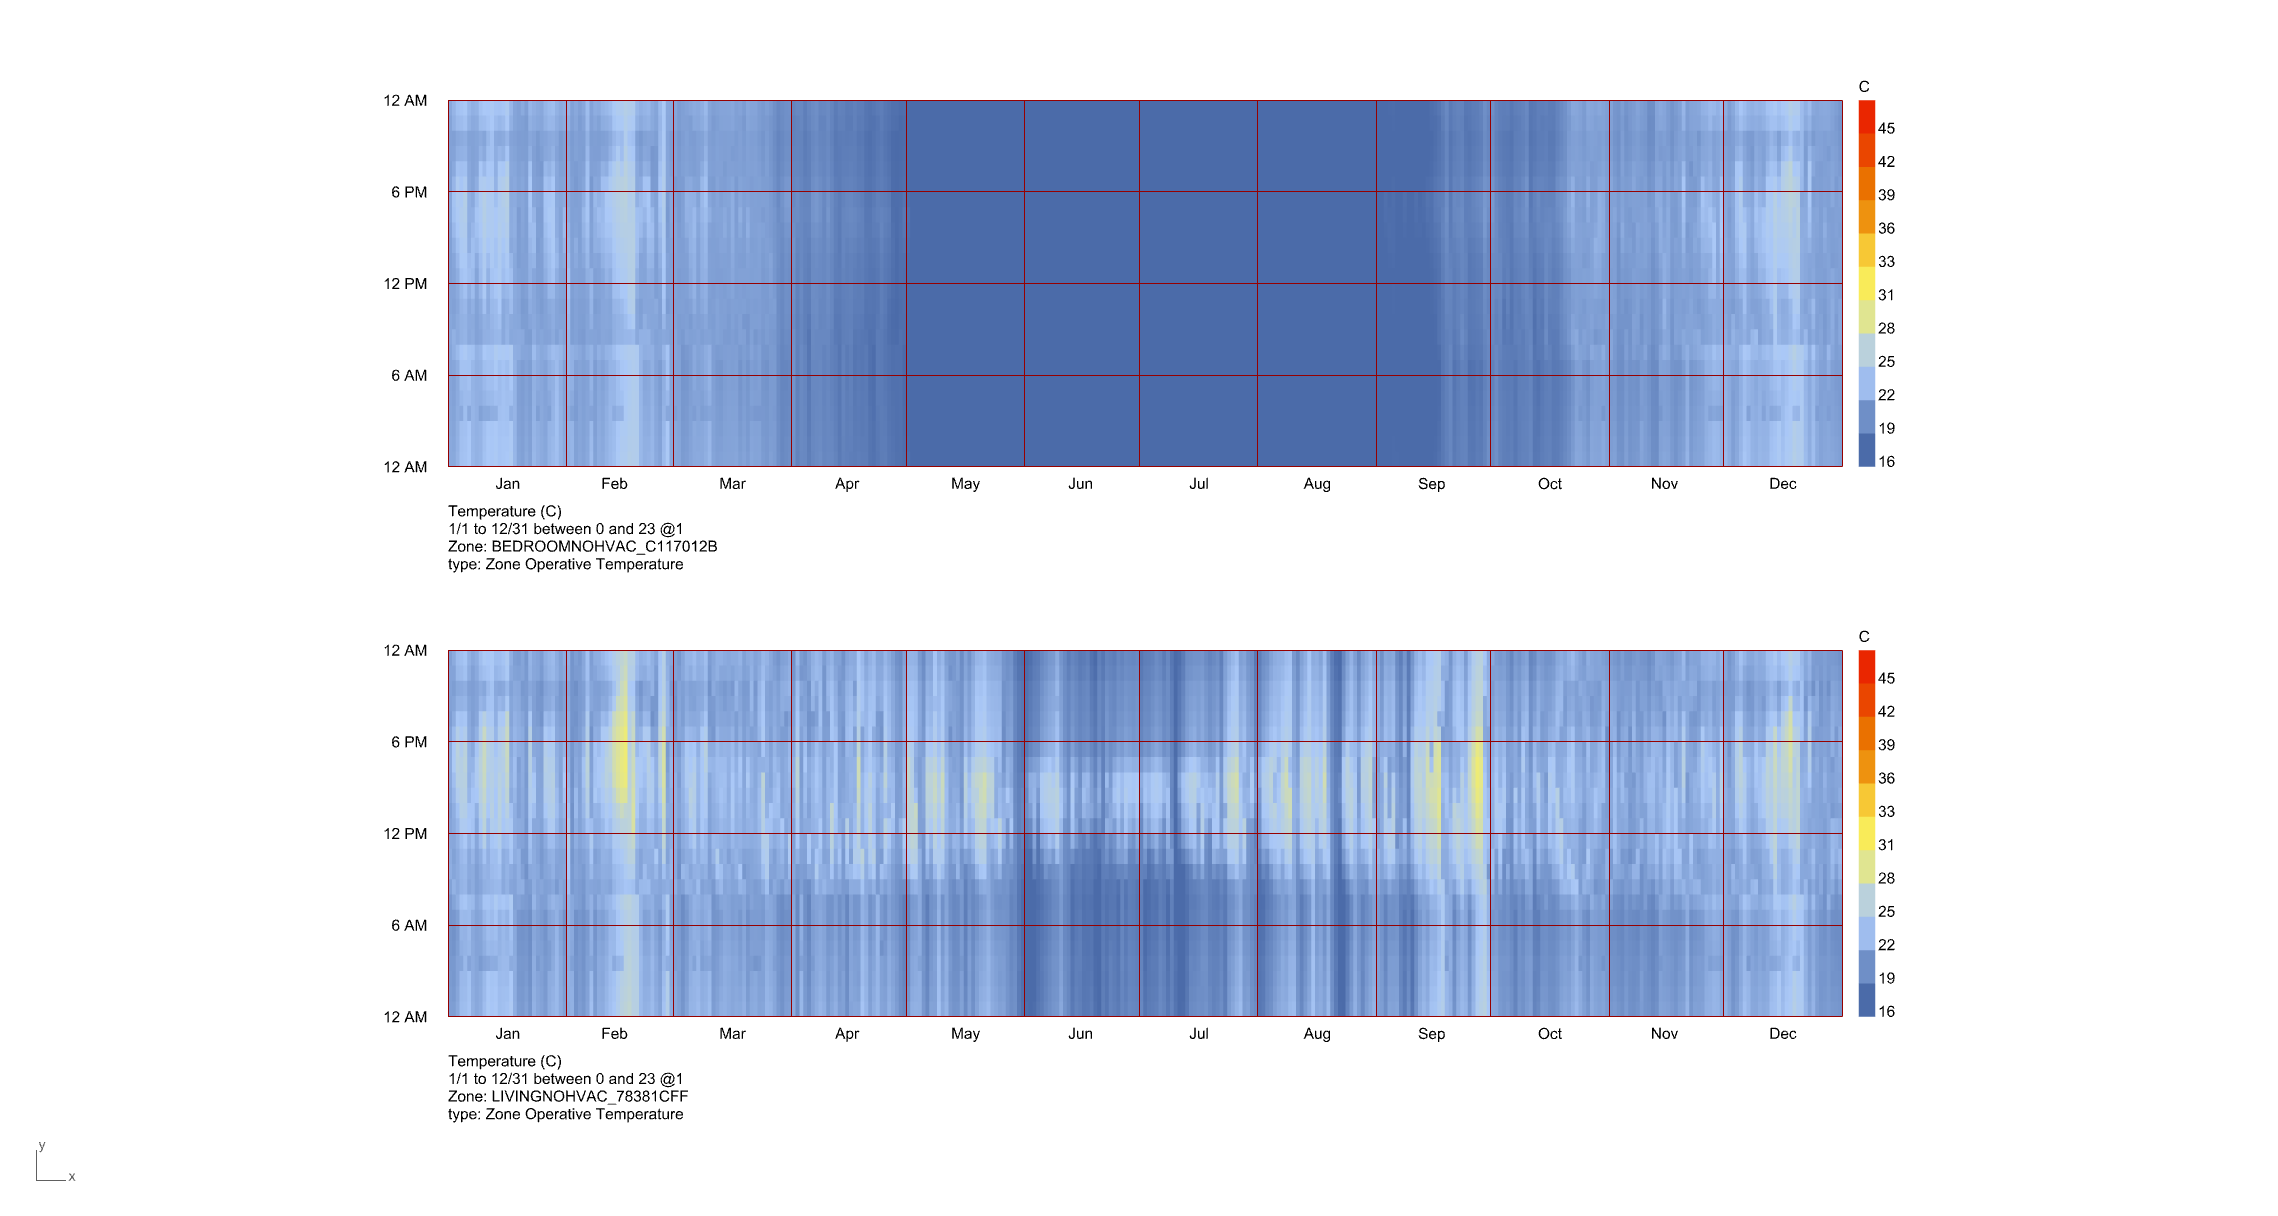
The job I am working on is currently (on one computer) exploring the implications of the proposed changes in the New Zealand Building Code energy performance proposals. It is running 945 parametric runs (3 climates x WWR facing North, proportion of the wall that is structure not insulation, 3 levels of airtightness, and the 3 levels of insulation out for comment). I am running EnergyPlus 3 times for each option: no heating or cooling to look at the indoor heat map; with ideal loads to produce an energy balance image; and with a heat pump installed to look at actual energy use. Linked to Colibri it is producing some interesting patterns. Each combo run is taking 6-7 minutes, so total is 6-7mins x 945 runs!
Happy to see my understanding of the situation fits with yours. Keep up the good work!
A great fit for Pollination! Exciting to see the results.
If our infrastructure scales as it should, you should be able to run it all in less than 10 minutes if submit them all together as a single job. Let me know if that will be the case. Also make sure you select a unique name for the model for each iteration so they don’t overwrite each other.
Hi @thedonn, We are hoping to showcase some real world examples on our blog post as we come out of early access. This looks like a good case to highlight, especially if it runs on Pollination in 10 minutes (compared to the 4-5 days on your computer). Would you be comfortable sharing details and images from your results to feature on our website and social media posts? Granted it all works ideally of course.
I am a little wary of running all 945 runs at once, and have yet to figure out how to transfer the data reliably to Design Explorer.
I beleive that if I can be of help in development it will be in this area of use cases, not in recipes. I looked at making a recipe that might allow me to simultaneosuly run my 1) free-floating temperature model; 2) ideal loads energy balance model; and 3) my heat pump energy use model. I decided quite quickly that, as it is at present, my knowledge of scripting was too ill-formed to be able to create a recipe.
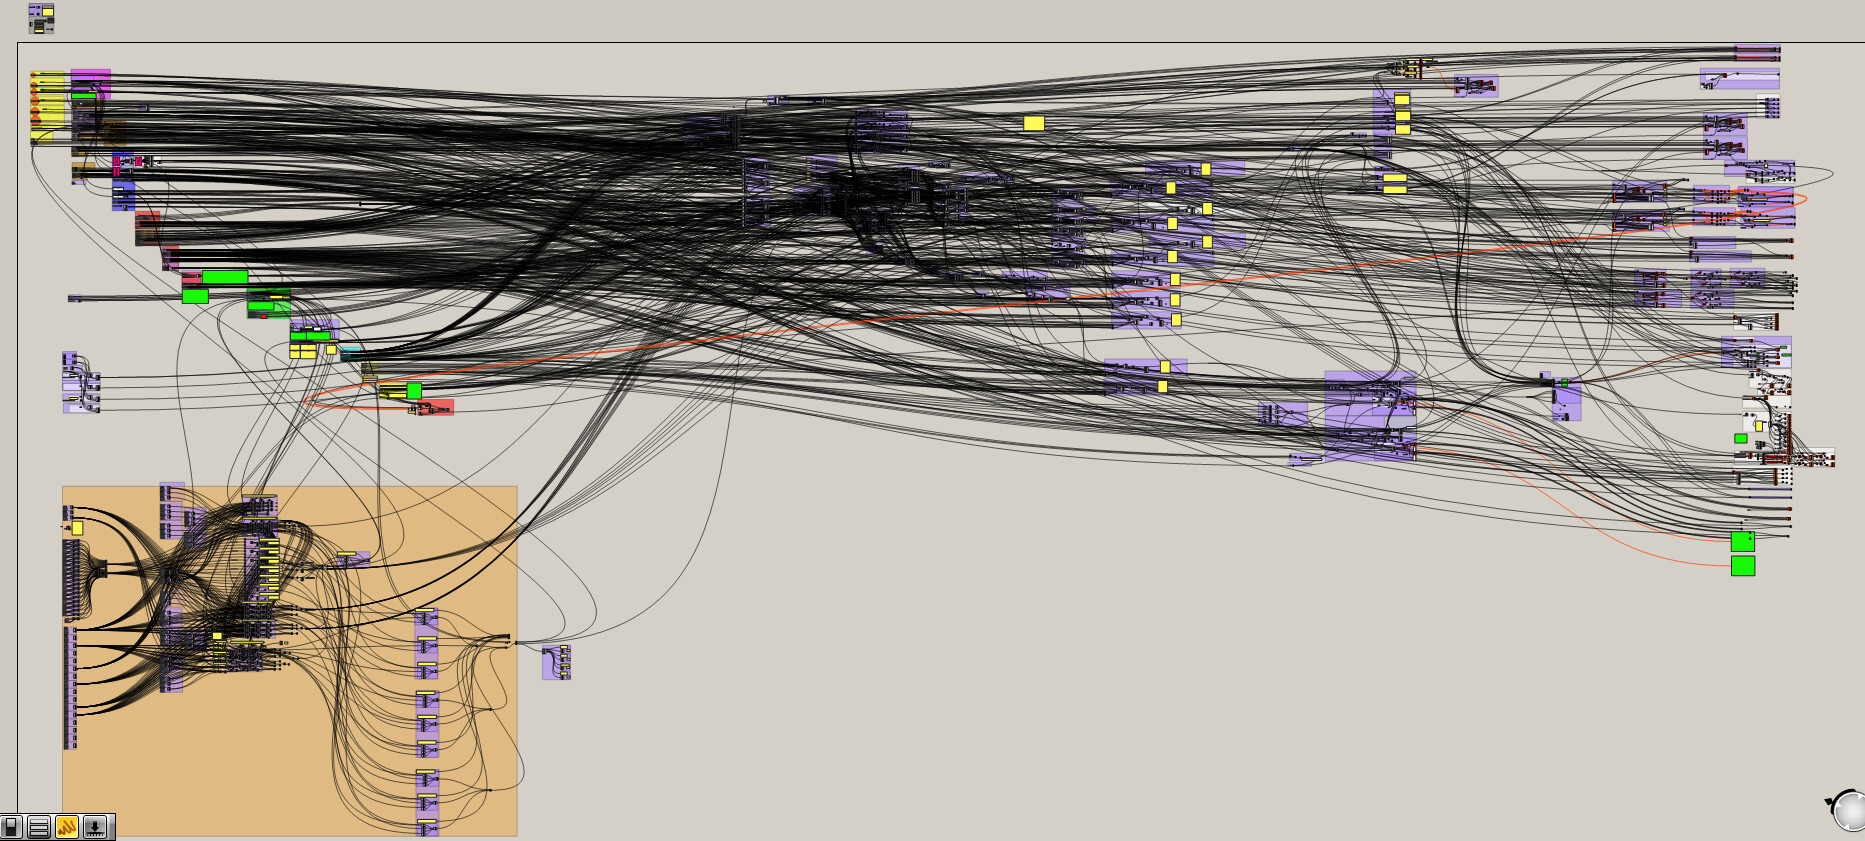
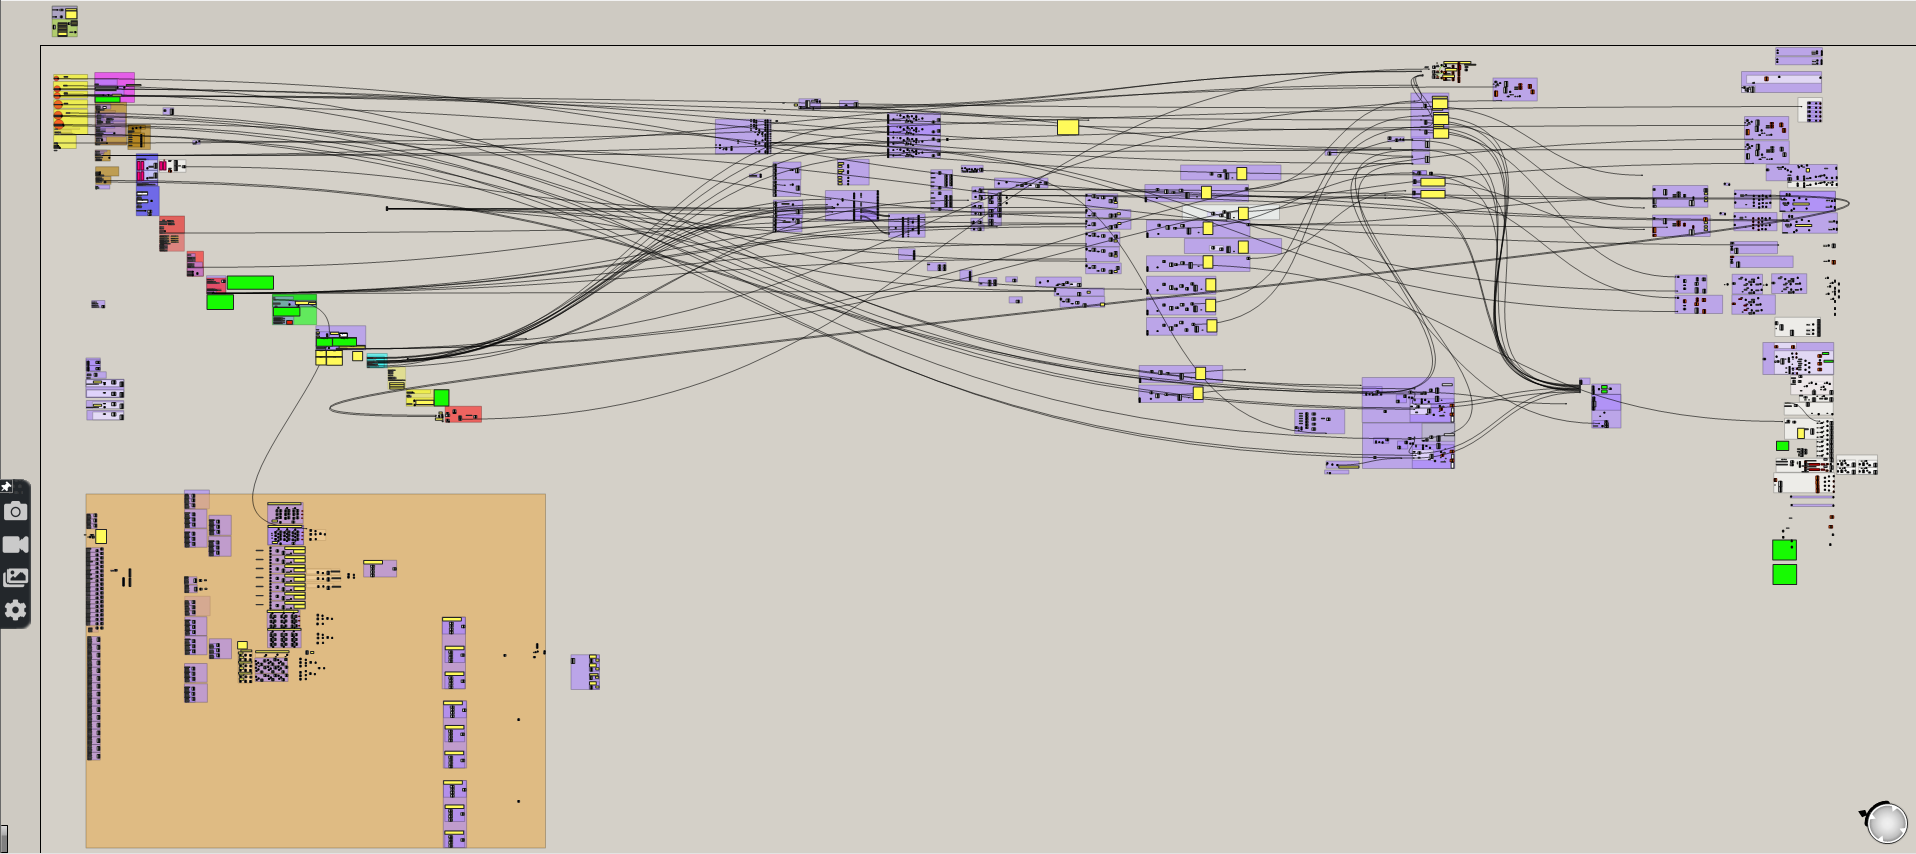
As noted in previous posts, the script is quite a tangle:
(coloured mid to top left positions are inputs; bottom left is materials; tangle in the middle is geometry creation (face by face, to enable two-zone house with 4 outside walls or apartment with 2 outside walls to be modelled); mid-right top are thermal zone creation with or without interzone opening for airflow network model; mid-right lower is daylight model, with simple 4 surfaces as walls for each zone, because the thermal zones have thermal bridging explicitly modelled, so 8 surfaces for 4 walls; far right is graphing of a bunch of things from surface temperatures to energy balances; just before that are the run energy model options…
Originally set up as a teaching tool - enabling examination of the issues, rather than teaching simulation.
Modified here to explore current building code insulation options.
Can you share a screenshot of the image that you are trying to create?
If I understand correctly, this is really a limitation with DesignExplorer and how it loads the images. It is probably helpful to make the size of images smaller so they can load quickly.
And, yes, the limitation seems to be Design Explorer not loading the images, though I am still struggling to figure out how to generate the images without downloading all the sql files.
Hi @thedonn, I thought I replied to this question already!
Unfortunately, we don’t have support for generating these charts on Pollination as is. That means you have to iterate through the runs and download the sql file and generate the graphics locally. It is not ideal but a practical workaround.
@ngimbal, here is a real world scenario of using charts and graphs for post-processing.
Thank you for the suggestion. Personally I am somewhat horrified at the spaghetti
There is a switch built-in that enables the script to be improved somewhat. While in development, I prefer to be able to see everything. However, I am wary of adding too many other tools into the “script” that would not work on the Mac and the PC (which is the intention of the script).