Hi guys,
So I’ve successfully run a thermal comfort analysis…or so I think. I’m not sure how to visualise the results. There are various outputs of the below but which components do I need to visualise this in Rhino?
Thanks!
Hi guys,
So I’ve successfully run a thermal comfort analysis…or so I think. I’m not sure how to visualise the results. There are various outputs of the below but which components do I need to visualise this in Rhino?
Thanks!
To add… I have been looking around at various tutorials but can’t seem to find one that goes with this recipe, sorry if I’ve missed it!
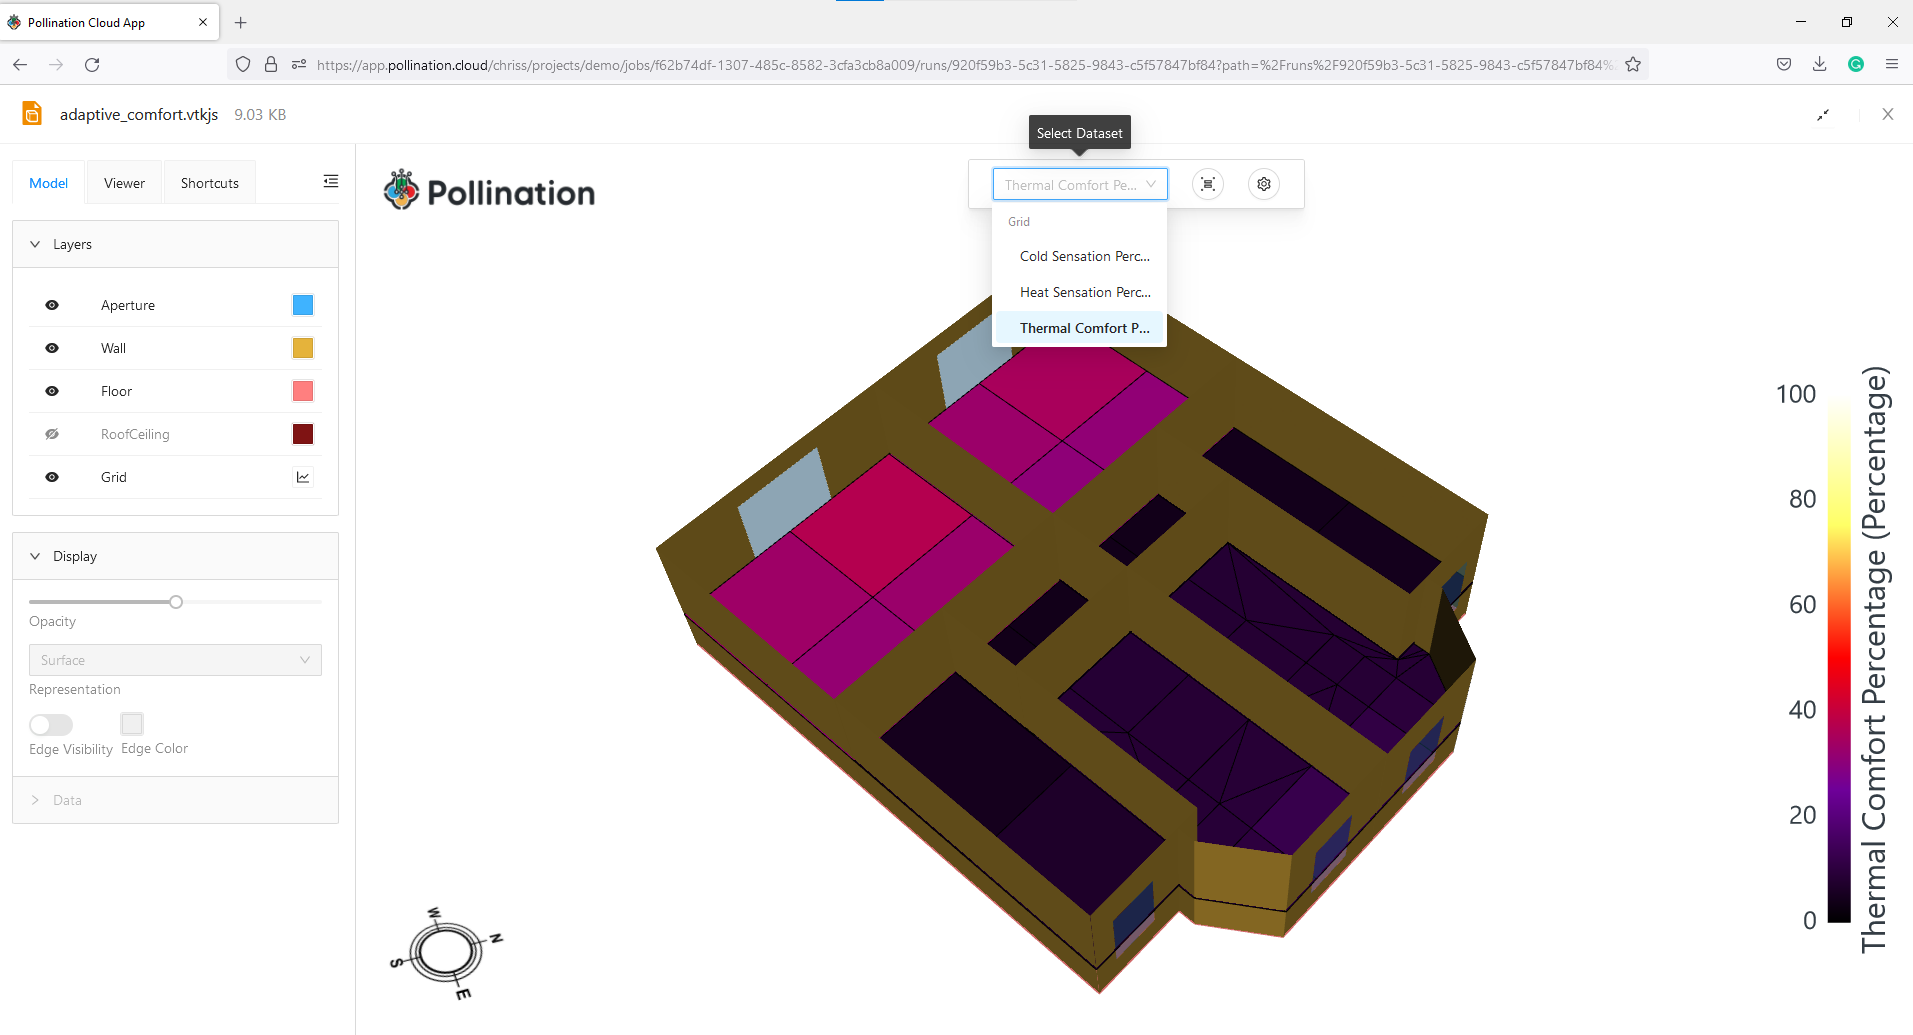
I suggest starting from the online viewer and checking the visualization output. It should be a good starting point to see the metrics that can be visualized.
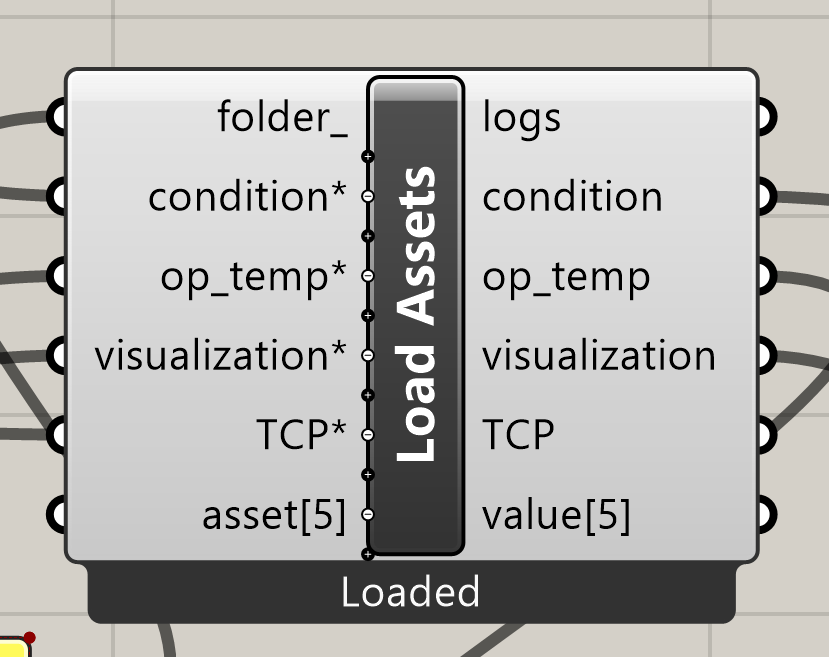
Thanks @mostapha, that’s helpful. However, I need to be able to start visualising other things like the operative temperature across the year. I’m a little confused about which components can be used with the “Load Assets” component.
I have used the “Check Inputs” component to get a honeybee model object, but now I need to combine this with the results and start displaying charts etc.
Chris
This sample file should help you get your bearings about doing in-depth analysis of thermal comfort maps in Grasshopper.
But, again, I really recommend following the suggestion that I made here unless you really need to study how the comfort conditions vary from one side of a room to another. You can just use the Custom Energy Sim recipe for this type of analysis as long as you use some simulation parameters that give you the thermal conditions in the output SQL file.
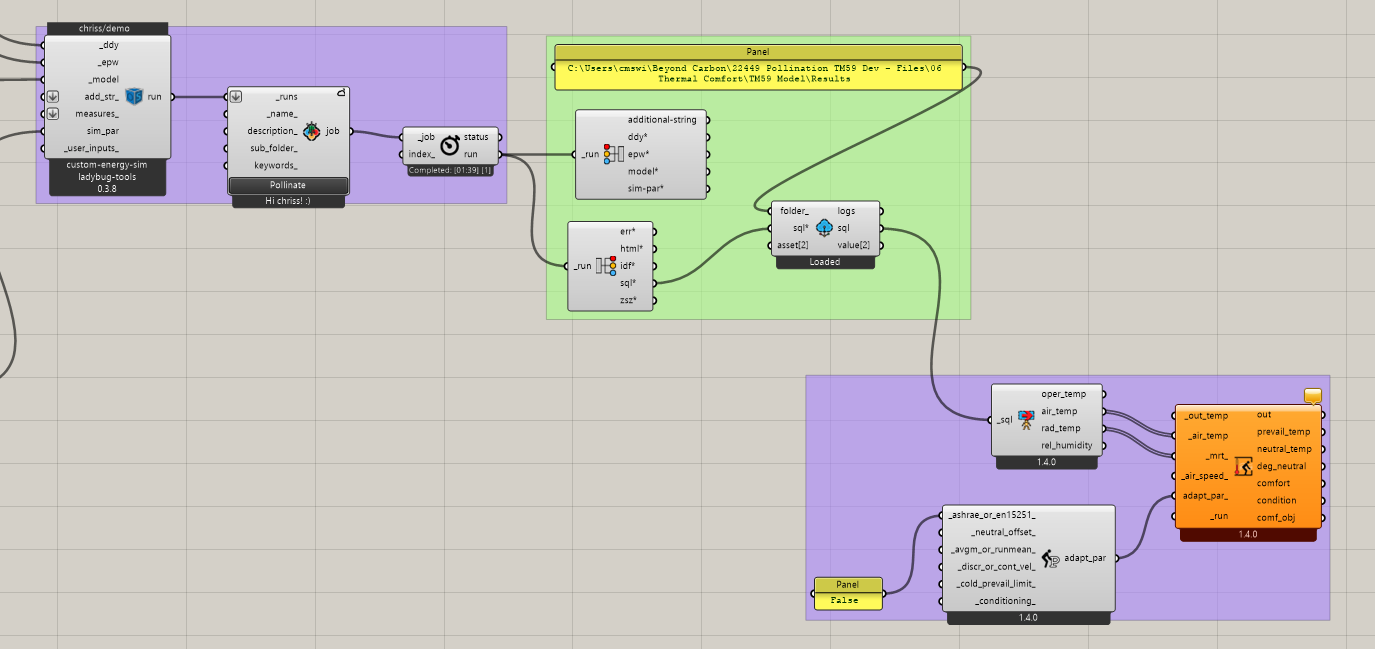
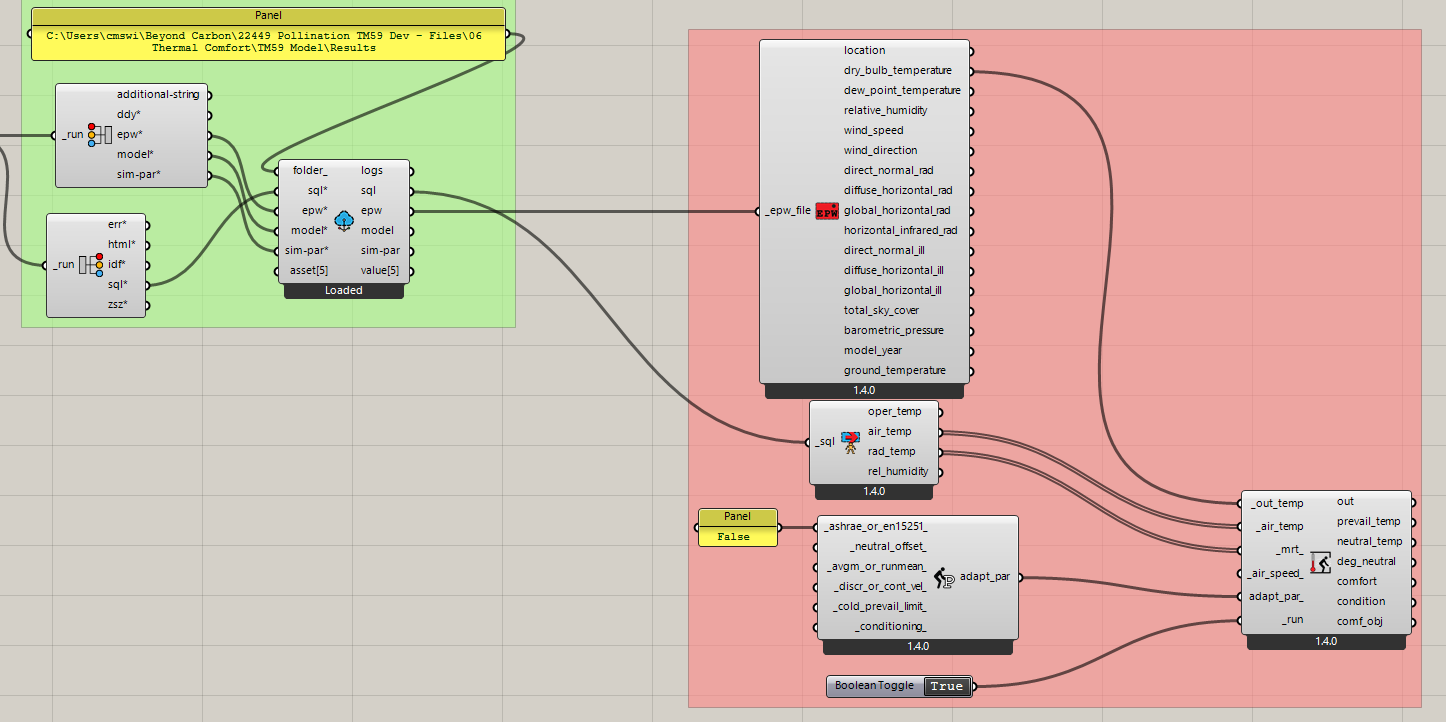
Thanks @chriswmackey I think this is exactly what I need. I’ve set up as below- but where do I get the outdoor temperatures from? Obviously they are in the EPW file but how do I extract them?
It looks good to me. You can also get the outdoor temperature as one of the simulation outputs. But as long as you’re checking the results on an hourly timestep, this should just work fine.
Ah how do you do that? I couldn’t see it on the list in HB Simulation Output component?
Now that I’ve got this working- I want to be able to do some post-processing of the data (namely, operative temp, neutral temp and outdoor temp) to generate my own comfort results (the end goal is to do all of this in Grasshopper). How do I get this data out? I note the Comfort Map recipe gives all the data as CSV files, but the Custom Energy recipe doesn’t.
Chris
Ah got it- “LB Dump Data”!
Hey @chriss ,
Sorry that I forgot to respond to this a few days ago.
I just wanted to confirm that what you’re doing there seems like it’s best workflow. It is possible to get EnergyPlus to write the outdoor air temperature into the SQL file for you (if you add it as a Custom Output) but I think what you have there is better and more reliable.
Aldo glad that you found the Dump Data component.