Hello ![]() community,
community,
One of the most common uses of Pollination cloud computing has been to run parametric studies to generate parallel coordinate charts like the one in DesignExplorer. The parallel coordinates chart works best for a single value for each study. As a result, we have seen thousands of studies where users used Grasshopper to download the raw results to calculate the average, minimum, and maximum values for each run.
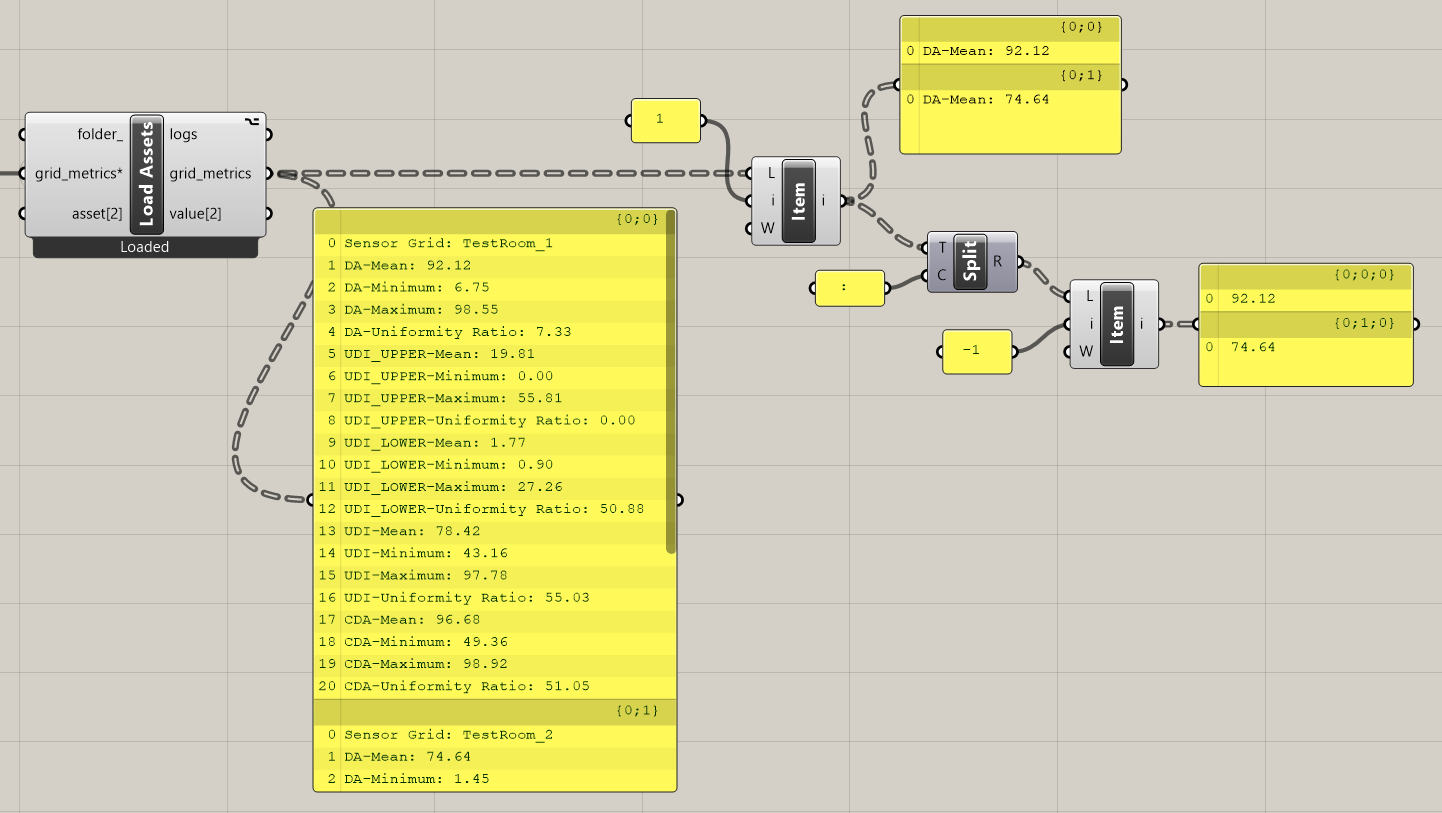
We are happy to announce that we have updated the annual daylight and daylight factor recipes to output a summary that returns the mean, minimum, maximum, and uniformity ratio of the metrics for each sensor grid. Here is an example output for a study with 2 sensor grids:

The new recipe output is shown below. One can select the desired item, e.g., the average daylight autonomy, and use native Grasshopper components to split the string and get the values. A sample of the workflow below can be found in the attached file:
grid_summary_postprocess.gh (8.0 KB)
We have also added a new input that allows the user to add additional customized grid summaries to the recipe.
Finally, as part of this process, we have also made a few changes to the annual-daylight recipe to provide a quicker version of the recipe for annual metrics.
For medium-sized models, the new annual-daylight recipe saves you 20-30% of the time, and for large models, it can save you 50% of the time. For huge models, it can even save you more than 80% of the time. In terms of CPU usage, it saves 15-30% regardless of the model size.
annual-daylight vs. annual-daylight-enhanced
Until now, the default annual-daylight recipe in the Pollination ecosystem has utilized an enhanced version of the 2-phase method, in which three separate calculations are put together to simulate the direct sunlight contribution more accurately. However, for many users, the accuracy of direct sunlight is not always important. After running several comparative studies we decided to change the default annual-daylight recipe to use the basic 2-phase method, which consists of a one-step calculation. This approach provides a quicker version of the recipe without compromising the accuracy of the results.
Users who need to use the more accurate calculation of direct sunlight can use the annual-daylight-enhanced recipe.
When should one use the annual-daylight-enhanced recipe?
For most studies the default annual-daylight recipe is appropriate but if you are not an expert on the topic, you might not know when the right time is to use each recipe. This section helps you to identify those cases.
To help decide which recipe to use you can ask yourself the questions below.
- Do I need to simulate aperture groups, and customize the post-processing with schedules for each aperture group?
- Do I need to examine the hourly illuminance values?
- Do I need any metrics calculated on the basis of the direct illuminance, e.g., Annual Sunlight Exposure (ASE)?
- Do I need to examine the direct illuminance at all?
If you answered yes to any of the questions above, you should use annual-daylight-enhanced. If you are still unsure if you should use annual-daylight or annual-daylight-enhanced create a new topic on the forum or leave a comment here and we can help you to pick the correct recipe for the job.
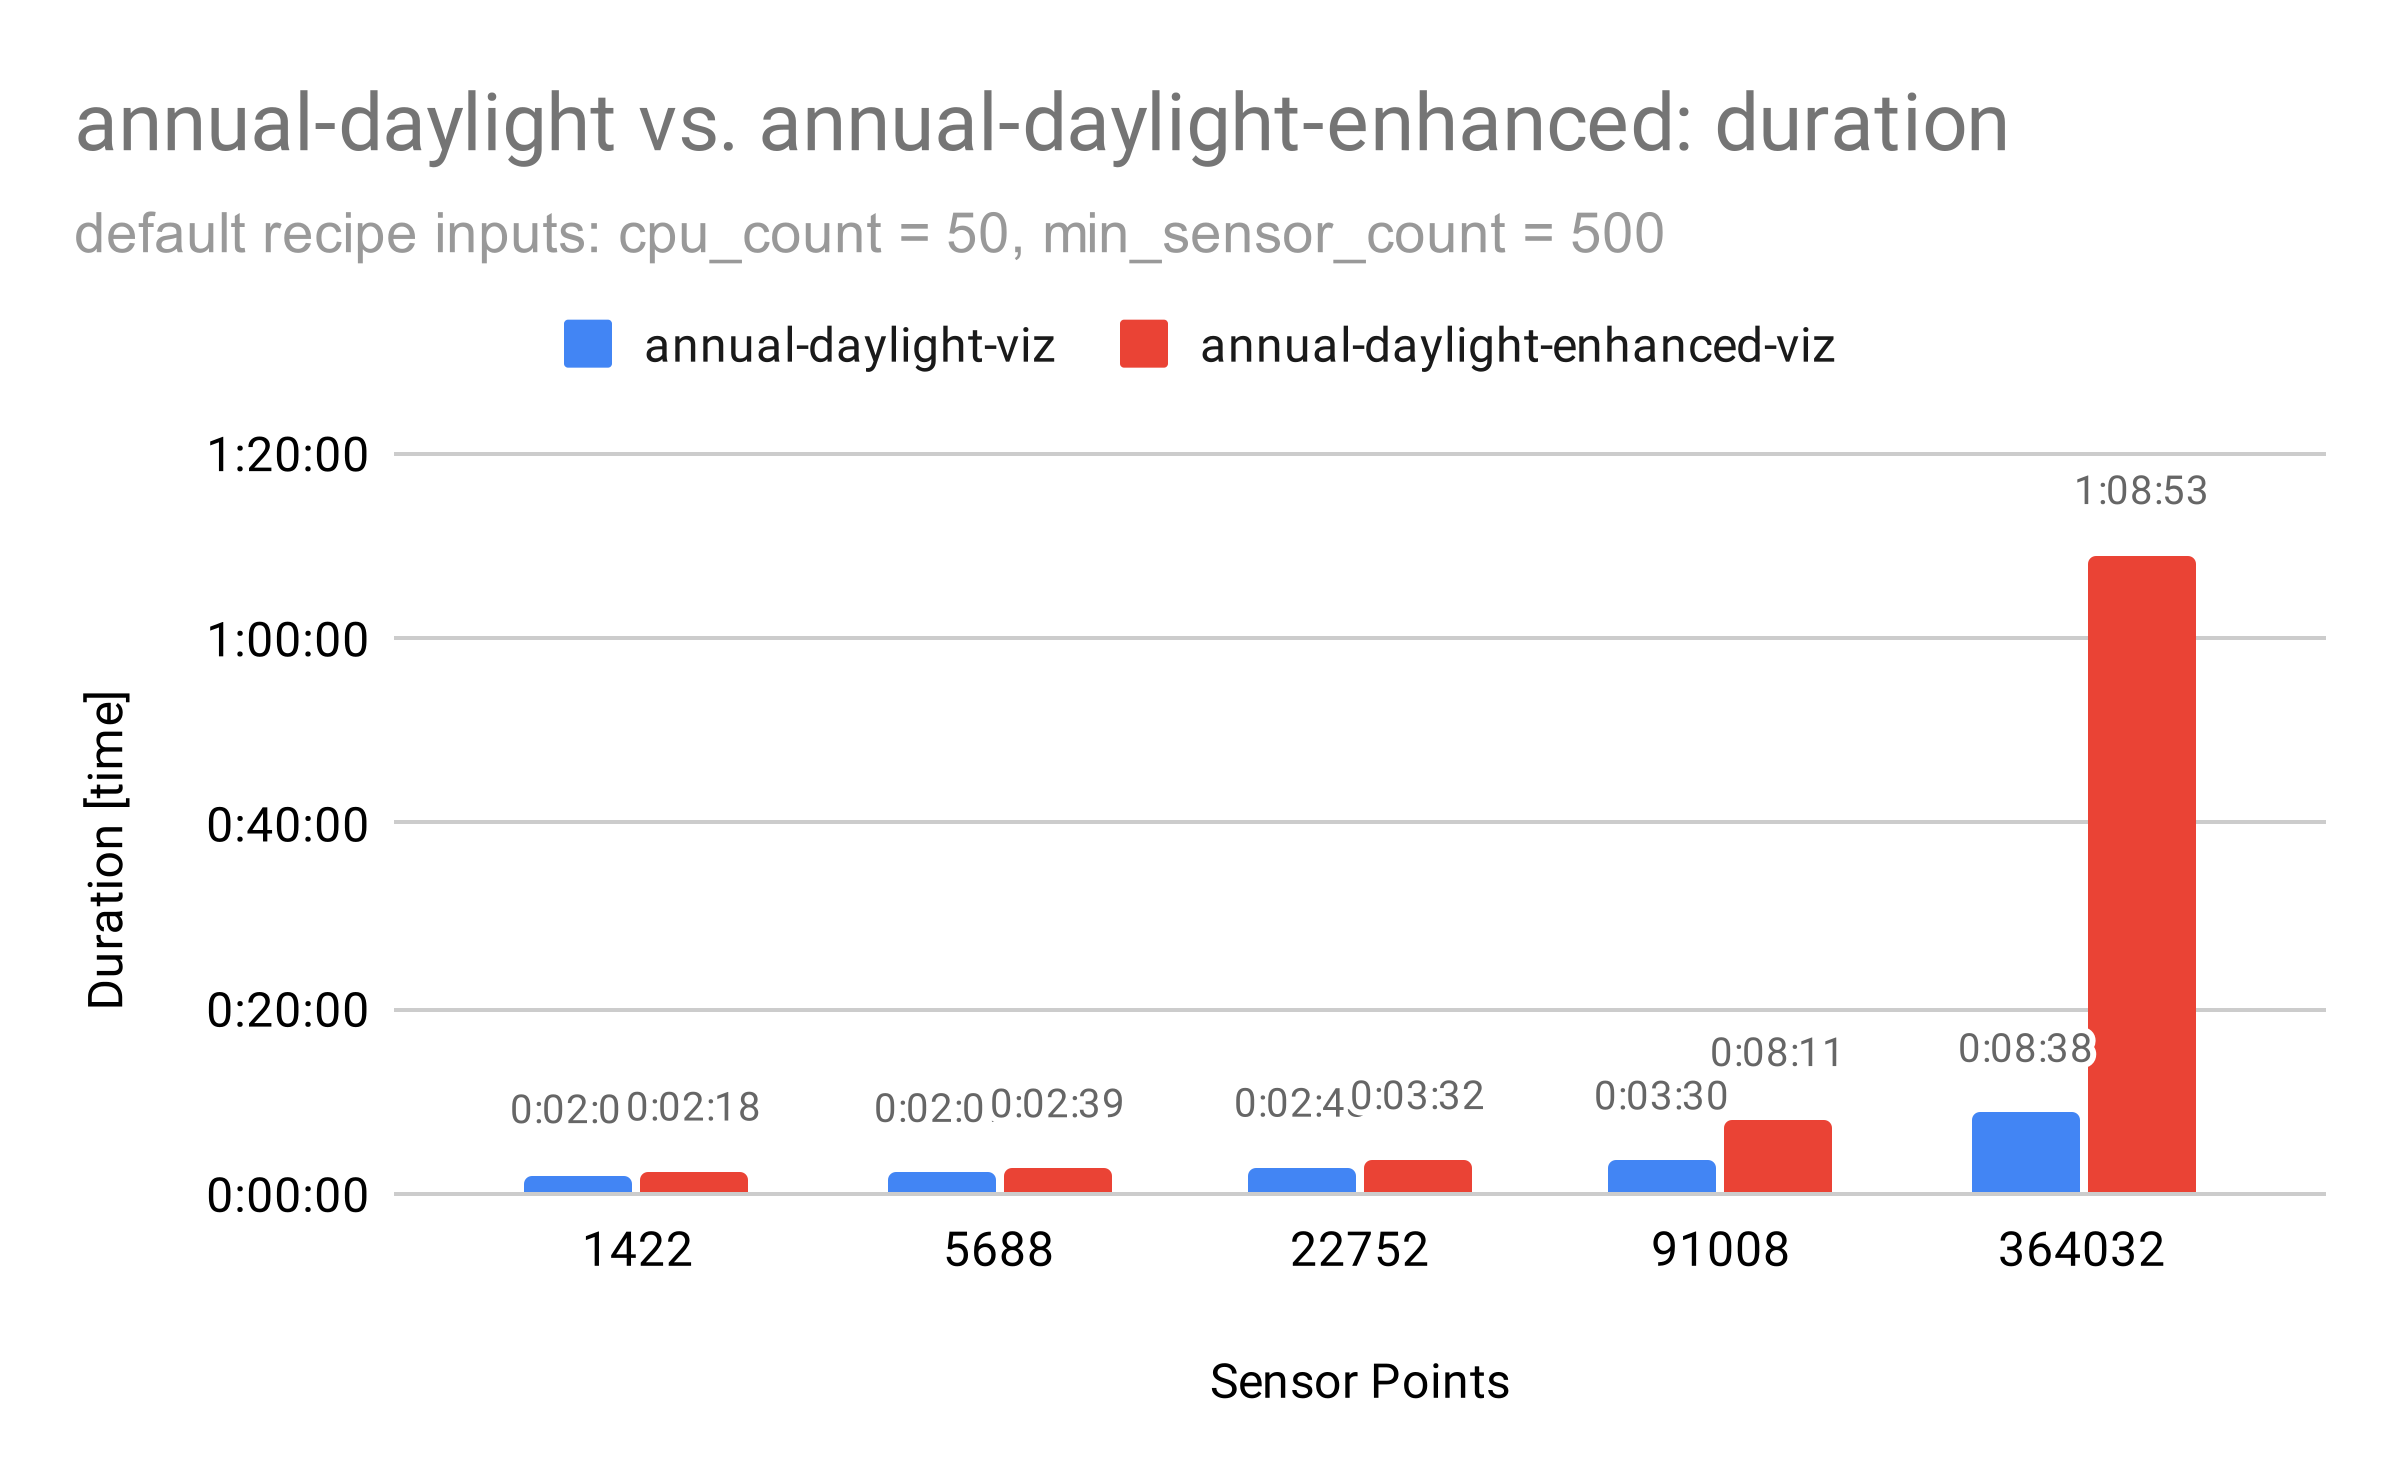
Scalability on Pollination Cloud
The structure of the new annual-daylight recipe results in better scaling of simulations on Pollination Cloud. Below is a graph that shows the duration of the for an increasing number of sensor points while keeping the CPU count fixed. While the duration can be lowered for annual-daylight by increasing the CPU count as the model grows larger, the same cannot be done for annual-daylight-enhanced since the post-processing is a bottleneck that is executed on only one CPU. This becomes a problem as the number of sensor points increases.
Customized grid summary with new recipe input
The new version of the recipes has an additional input which makes it easier to do basic summarized post-processing for each sensor grid. This input works similarly to conditional statements in Ladybug components. For example, you can calculate the % of sensors with daylight autonomy higher than 80 as part of the recipe post-processing.
By default, the mean, minimum, maximum, and uniformity ratio (minimum / mean) will be calculated for each sensor grid. It is possible to customize these calculations by percentages above or below a threshold, or percentages within a range. The input can be added as a JSON file or a string input; see examples below.
These calculations will be presented in a CSV file as a recipe output.
Examples
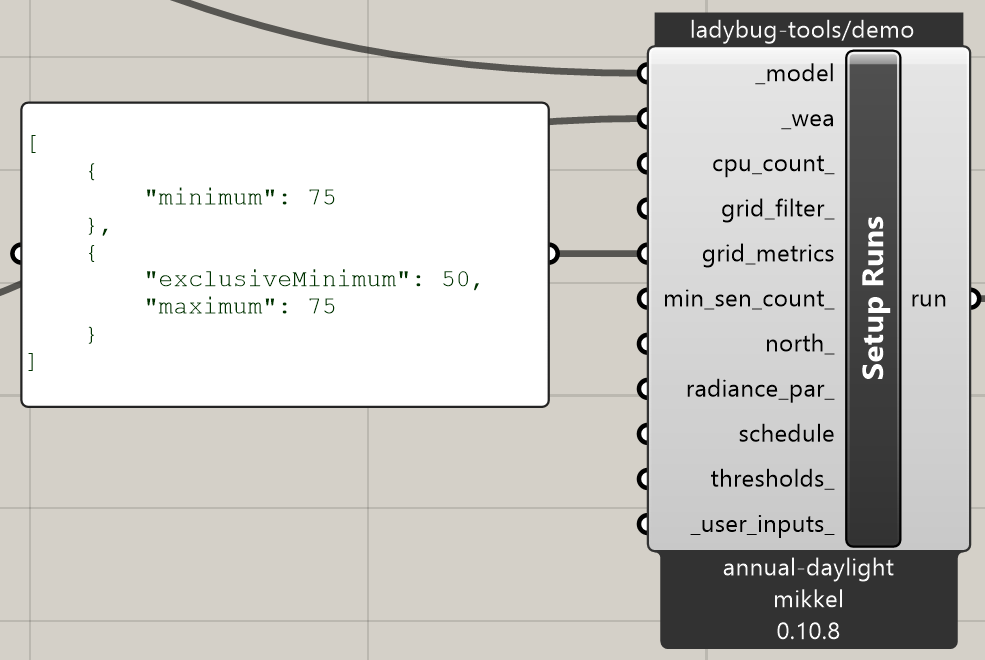
We have adopted JSONSchema specifications for defining the threshold inputs. For example, to calculate the percentage of sensor points above 75% of each of the five annual daylight metrics, e.g., > 75% DA, you should use the following input.
[
    {
        "minimum": 75
    }
]
If you want to add another condition, e.g., 50 <= DA < 75, you can expand the input by adding another item to the list.
[
    {
        "minimum": 75
    },
    {
        "exclusiveMinimum": 50,
        "maximum": 75
    }
]
![]() The new recipe input is also added to the daylight-factor recipe.
The new recipe input is also added to the daylight-factor recipe.
Multiple tags for each recipe
Before this release each recipe would come with two tags. One was the default recipe versioned as x.y.z and another one with and additional -viz. The new release has an additional tag for -full. This change allows you to pick the right recipe for your case based on the required inputs for your studies.
You can see the different tags and their output in the table below.
| Tag | DA | CDA | UDI | UDI (Lower) | UDI (Upper) | Grid Summary | Visualization | Results folder |
|---|---|---|---|---|---|---|---|---|
x.y.z |
||||||||
x.y.z-viz |
||||||||
x.y.z-full |
The five annual daylight metrics are:
- DA → Daylight Autonomy
- CDA → Continuous Daylight Autonomy
- UDI → Useful Daylight Illuminance
- UDI (Lower) → Useful Daylight Illuminance (Lower)
- UDI (Upper) → Useful Daylight Illuminance (Upper)
Many users will not need the results folder, which is mostly used for customized post-processing, or recalculating the five annual daylight metrics with different thresholds or occupancy schedules. Having these different tags is particularly useful for cloud simulations since the results folder is the largest output in terms of disk space and takes the longest time to process at the end of the cloud run.
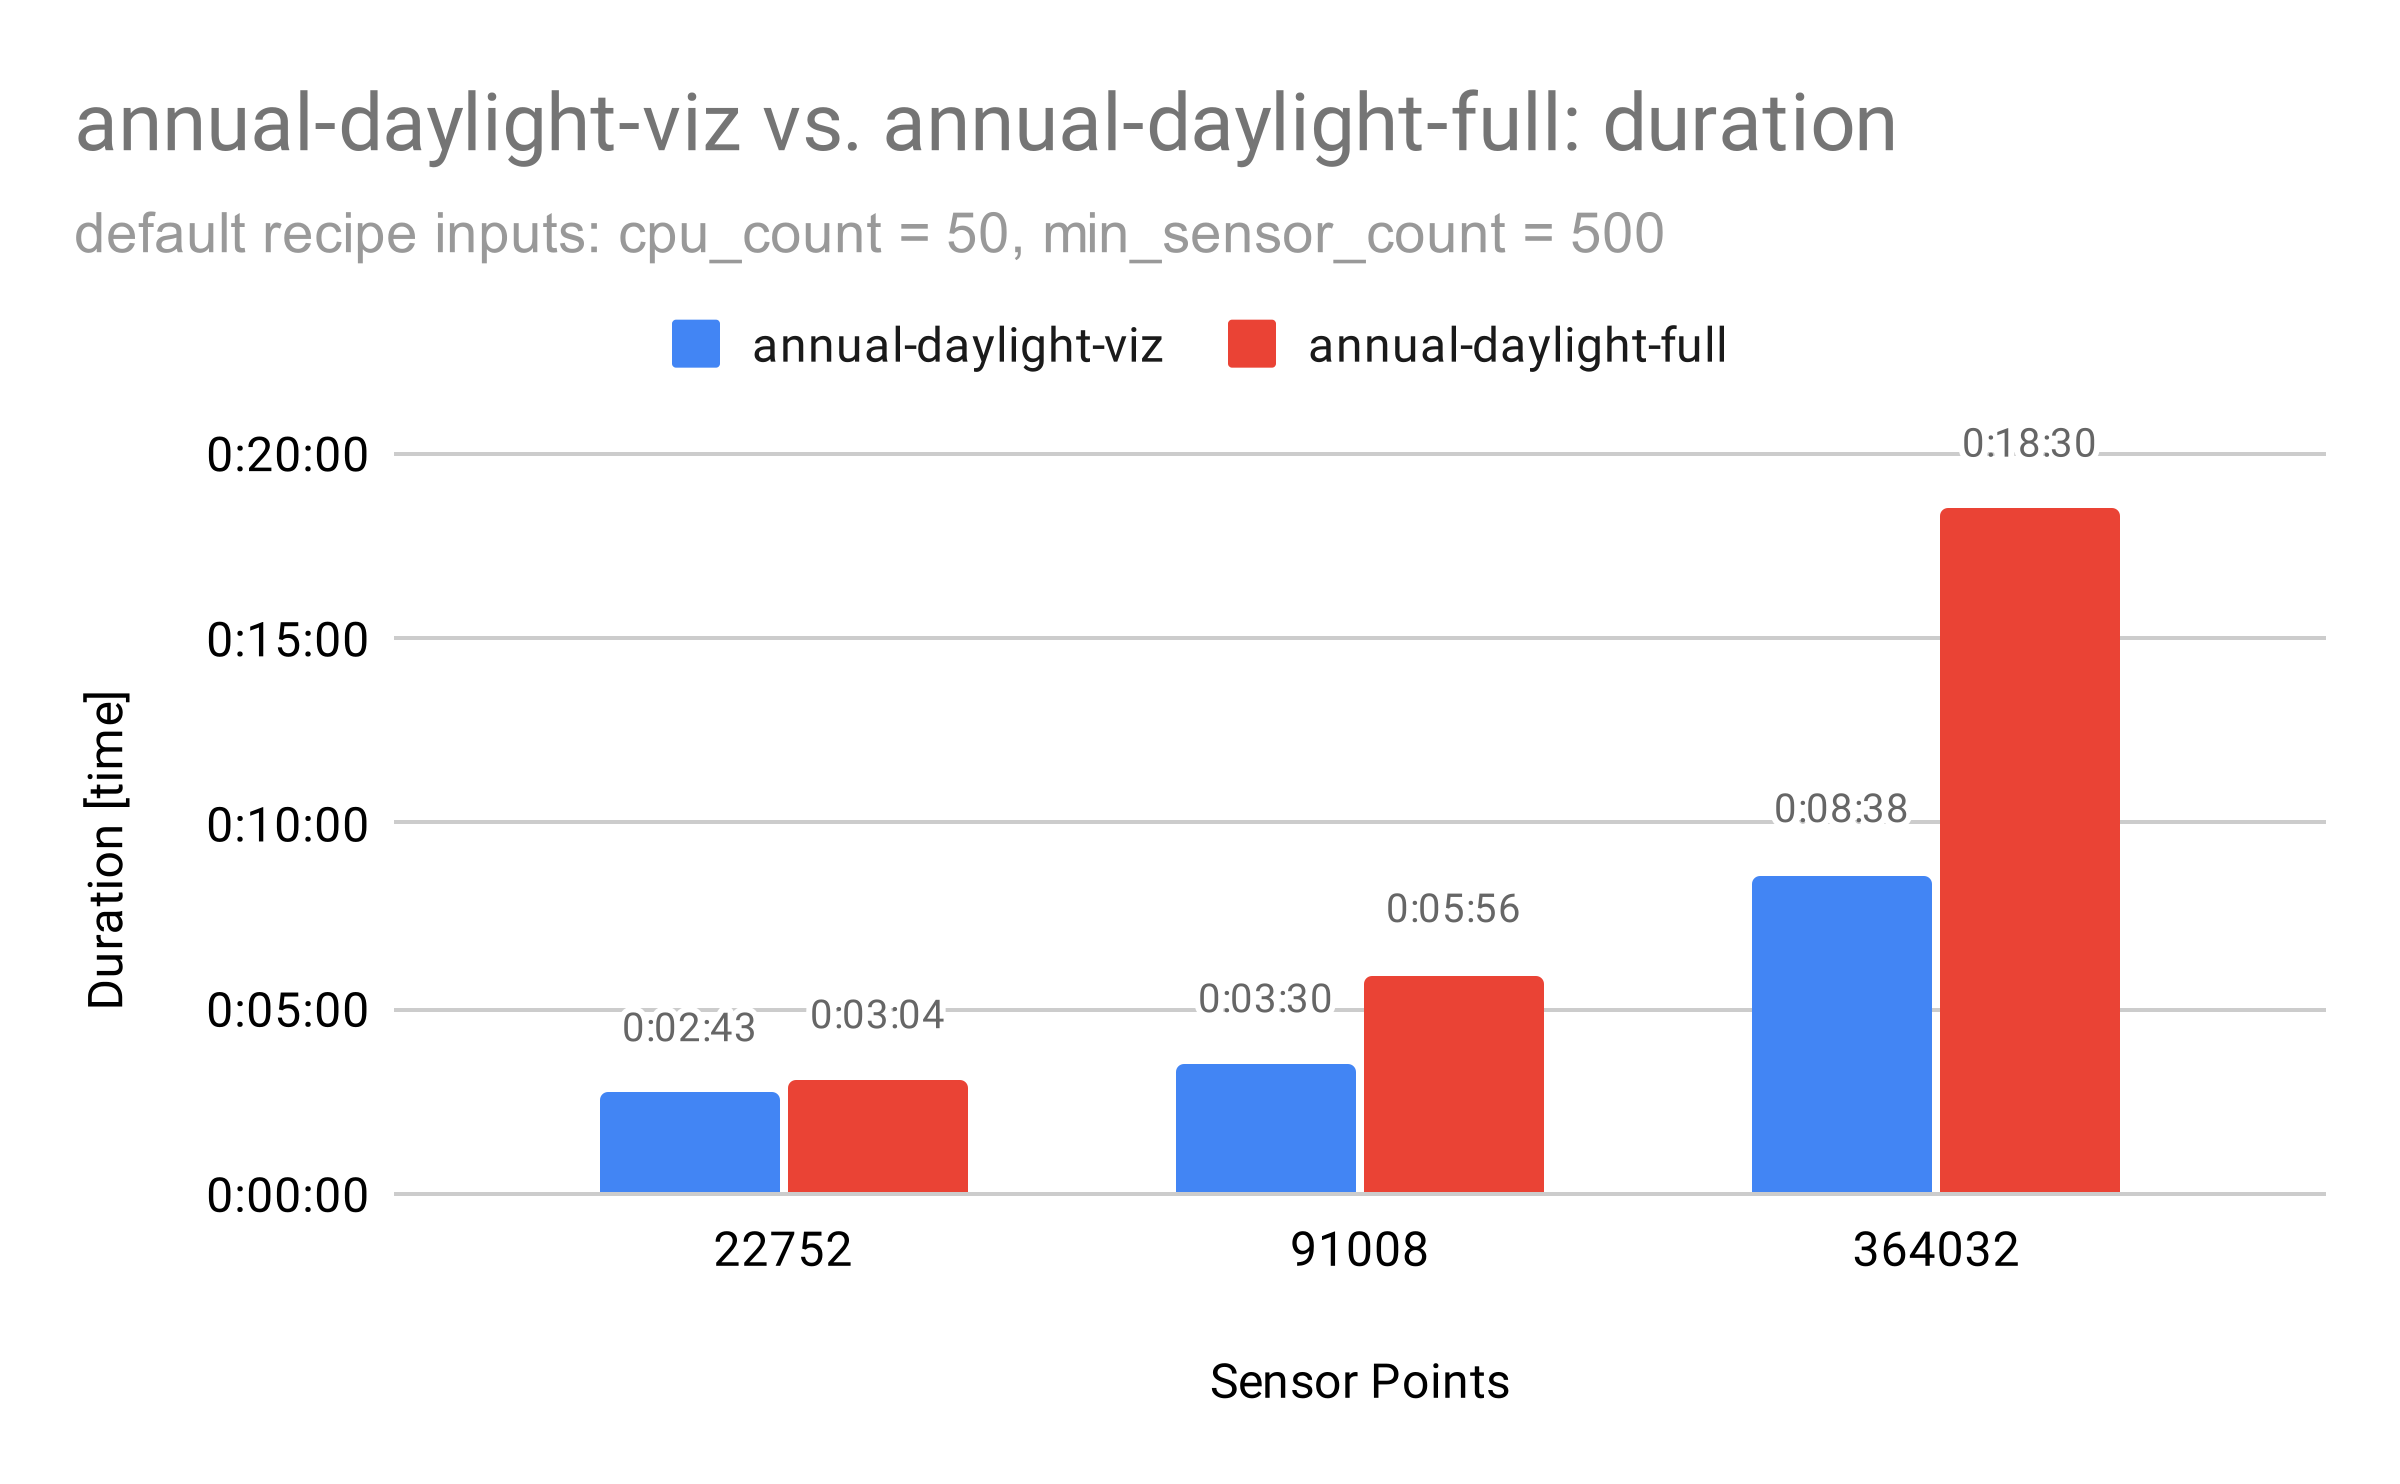
A comparison between the -viz and -full tags can be seen in the graph below. The only difference between these two tags is the restructuring of the illuminance results to a results folder and zipping the results folder as an output. For smaller models, this is not noticeable, however, as displayed in the graph it can double the duration which is not desirable if the user does not require the results folder. Previously the results folder was not optional. It was a recipe output whether you wanted it or not, but now it will be an option.
We are looking forward to hearing your feedback.
Happy Pollinating! ![]()