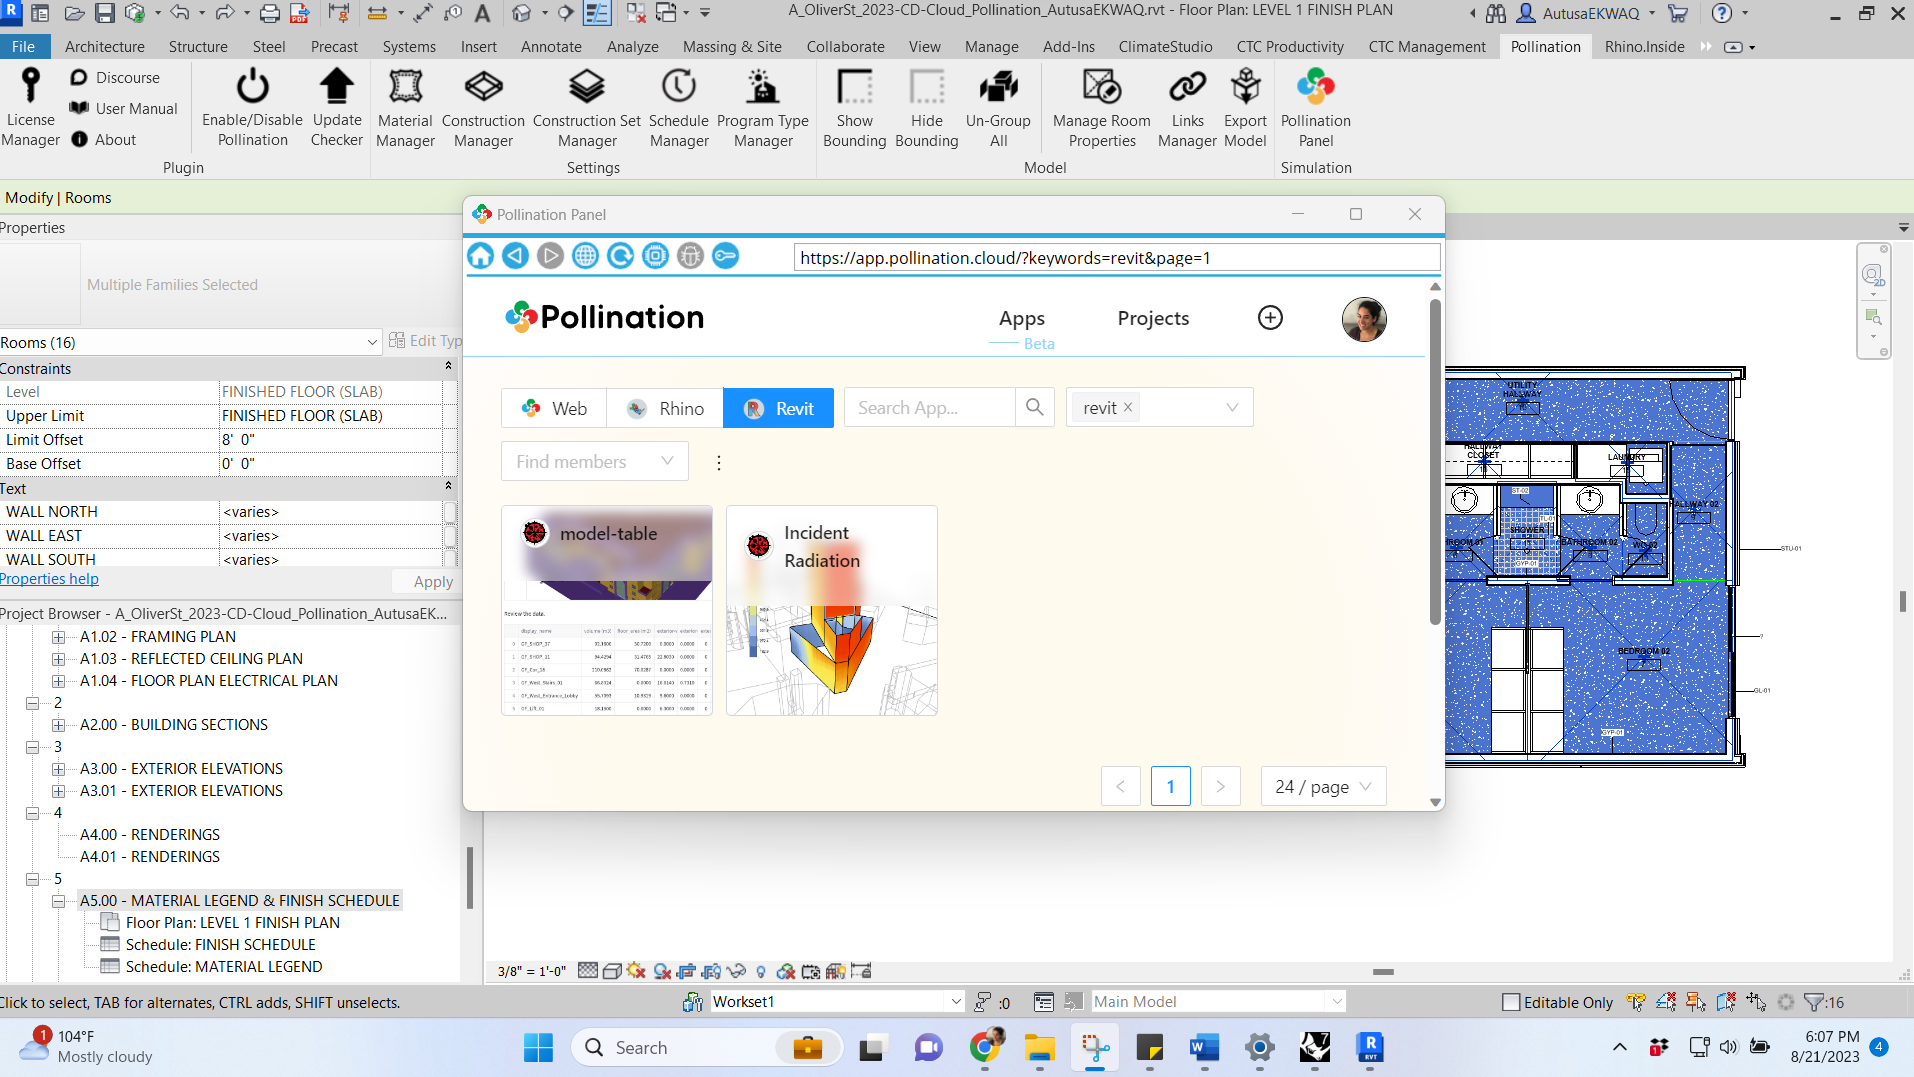
I followed this training video and was not able to find the recipies icon in revit nor get annual or hourly (8760) energy modeling results in the could version. Am I able to get annual or hourly (8760) energy data with Pollination out of Revit?
If not, do the Rhino or Grasshopper versions have this capability?
Hi @autusabehroozi, welcome to the forum! 
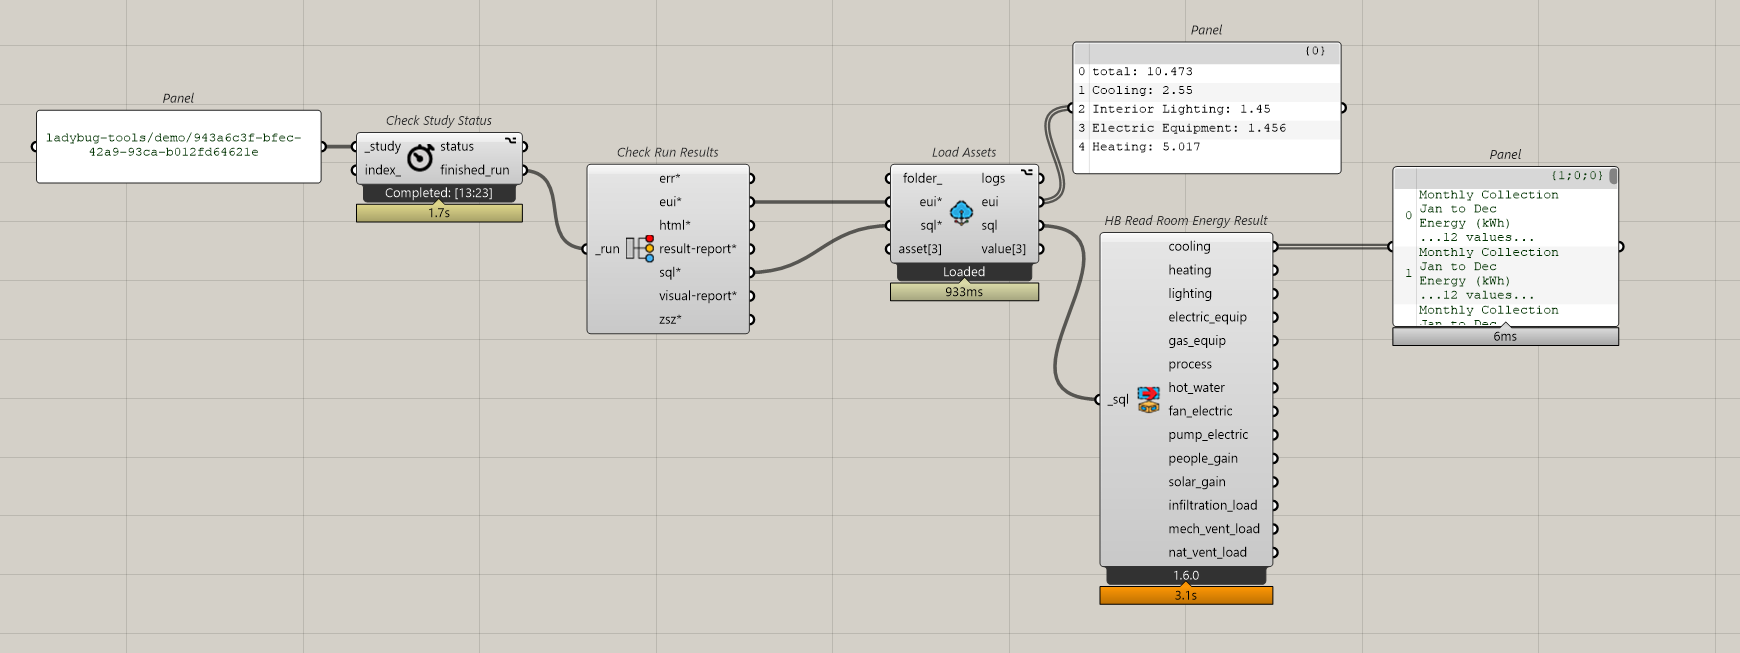
If you run your simulation using the annual energy use recipe you get an SQL file of the results that includes the hourly outputs. You can use the Ladybug Tools Grasshopper components to extract the outputs and visualize them. We don’t have that functionality built-in for Revit yet. Here is an example of loading the results for this study. In this case, the report frequency is monthly so you get 12 values instead of 8760 but the workflow is basically the same.
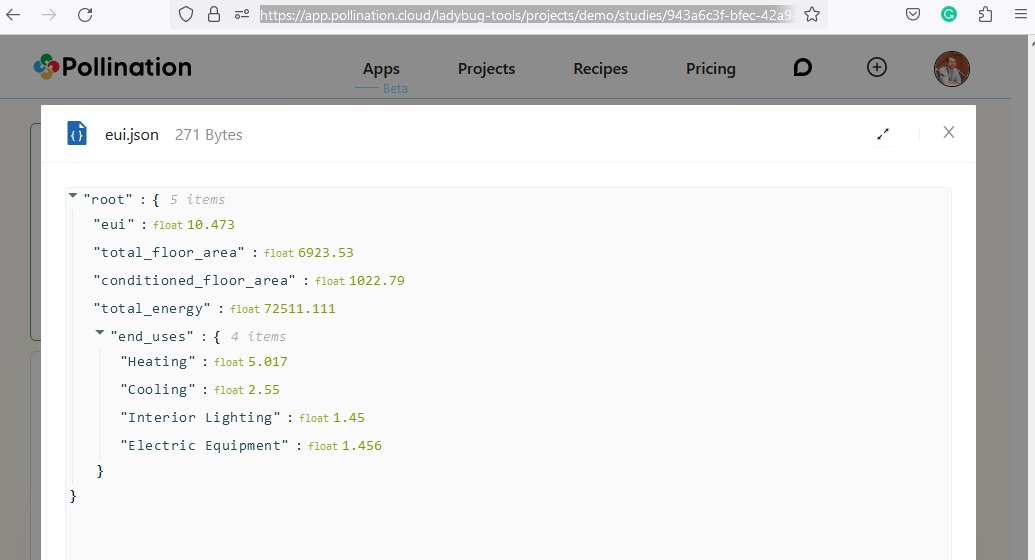
As you can see above, there is also an output that includes annual values like the EUI. You can also see those values on the web interface.
Hey Mostpaha, Thank you so much for this thorough response.
Looking forward to the day when the capability is inside the Revit Pollination Plug-in as well. Seems like it is not far out.
Thank you, AB
1 Like
You’re absolutely right! We can technically write an app that loads the energy simulation results and visualizes them in the panel but we have been cautious about that since the solve adjacency routines in Revit are not fully implemented for detailed models. We have already implemented it in our core libraries and will add it to the Revit plugin at some point in the near future.
1 Like