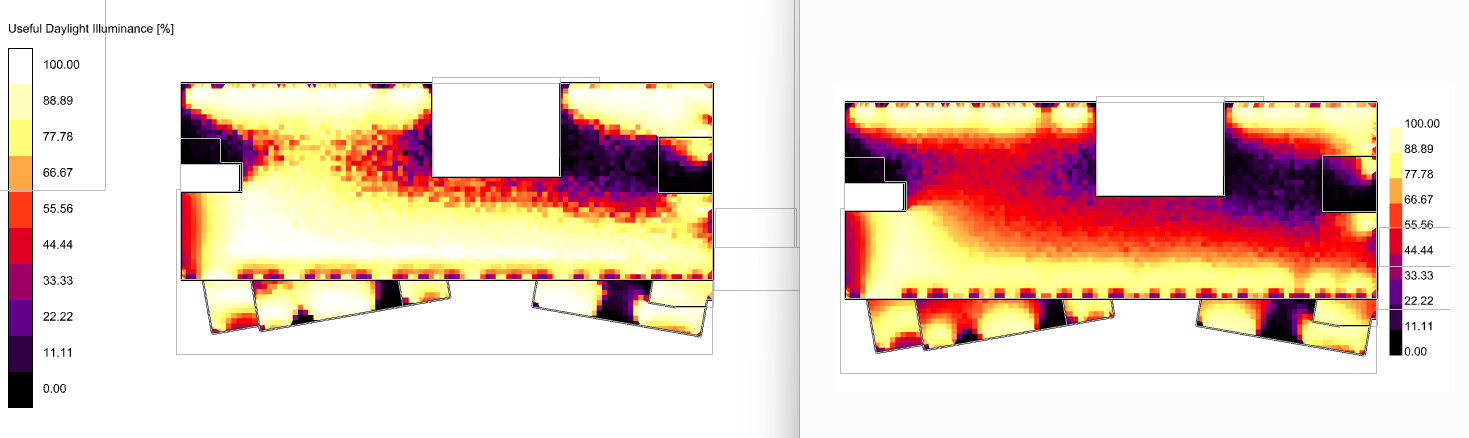
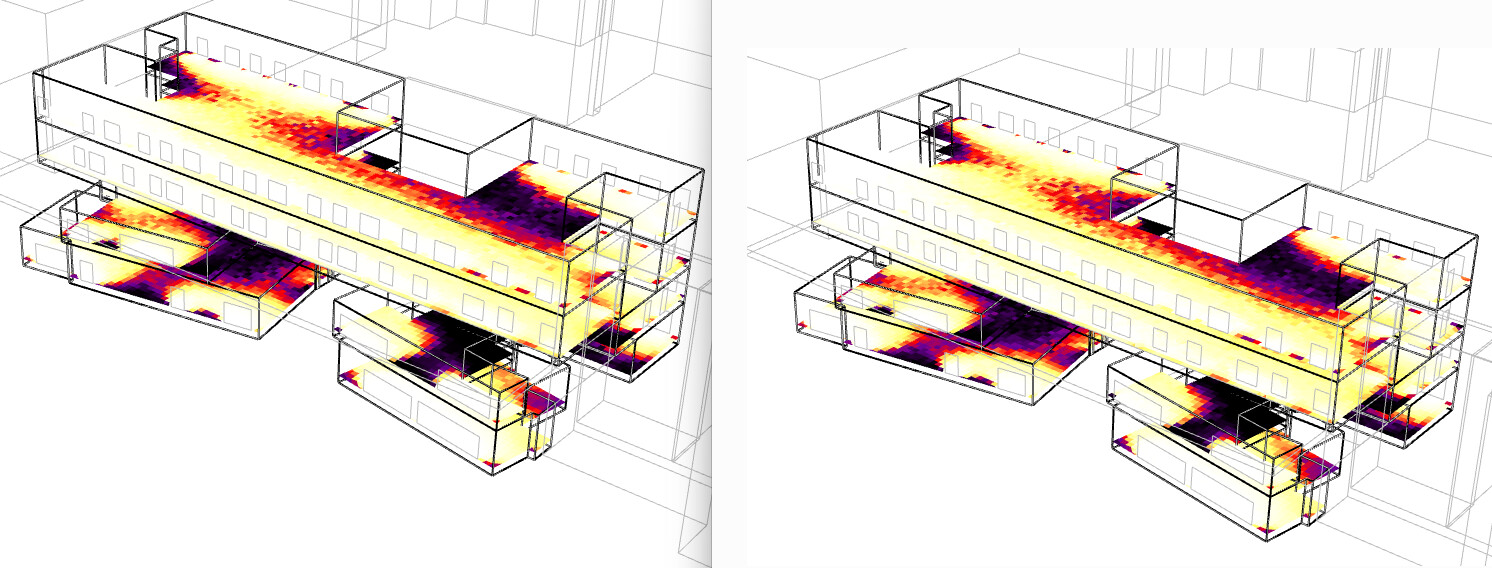
Out of my curiosity, I wanted to compare the result of annual daylight recipe with annual daylight enhanced component and below shows the result of UDI (left is daylight recipe and right indicates the result of annual daylight enhanced component):
Thanks for sharing this. I am not surprised that annual-daylight shows higher values than annual-daylight-enhanced, but the difference in your results is larger than expected compared to the models I have tested. Are you able to share the model? You can share it in a PM, and I will take a look.
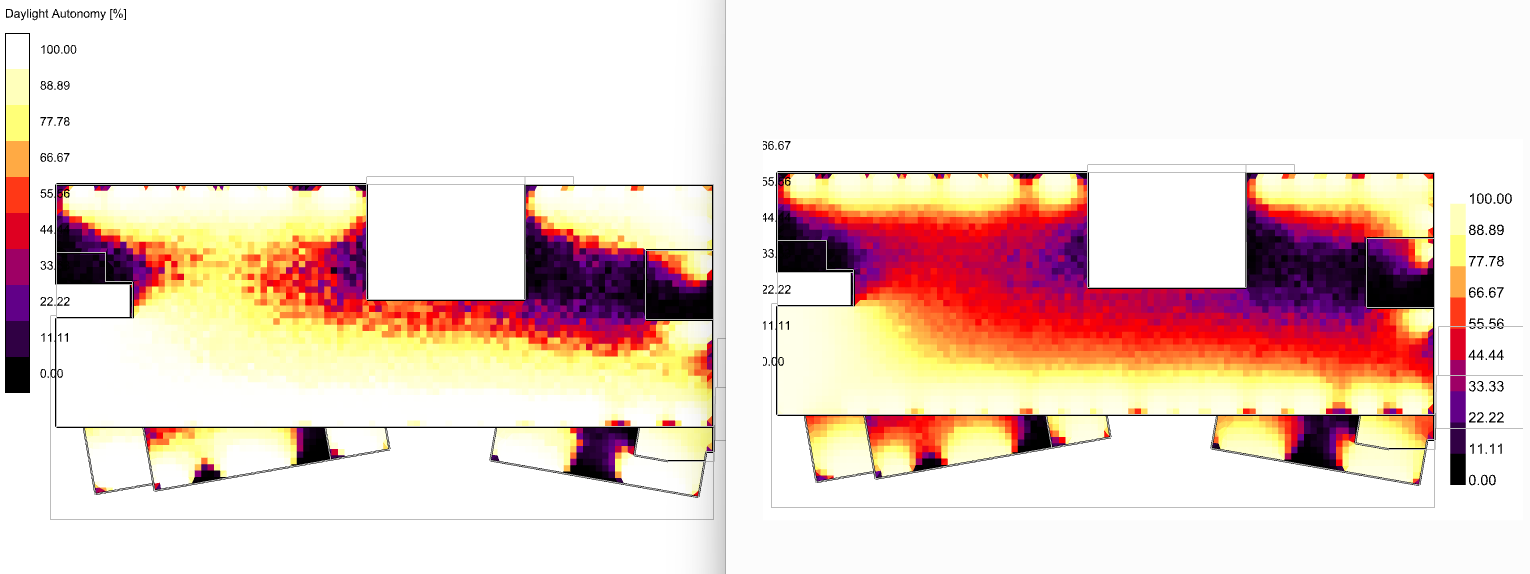
Are you sure that the inputs are the same, and you are visualizing the right metrics? Can you compare the actual values of DA / UDI from the recipe outputs?
Thanks @mikkel, I reviewed all the inputs again and found the issue. It was the weather link issue! I did not notice it at all, I appreciate your help to find it.