When creating the VisualizationSet JSON for the send_results method in Rhino, is there a way to categorize the data values? As in specifying each value range to a corresponding color.
Hi @lucaslima ,
There is a LegendParametersCategorized class that can be used to set up a legend where you categorize the results based on a domain of ranges.
Here is a sample .vsf JSON file that makes use of it to display Daylight Factor ranges:
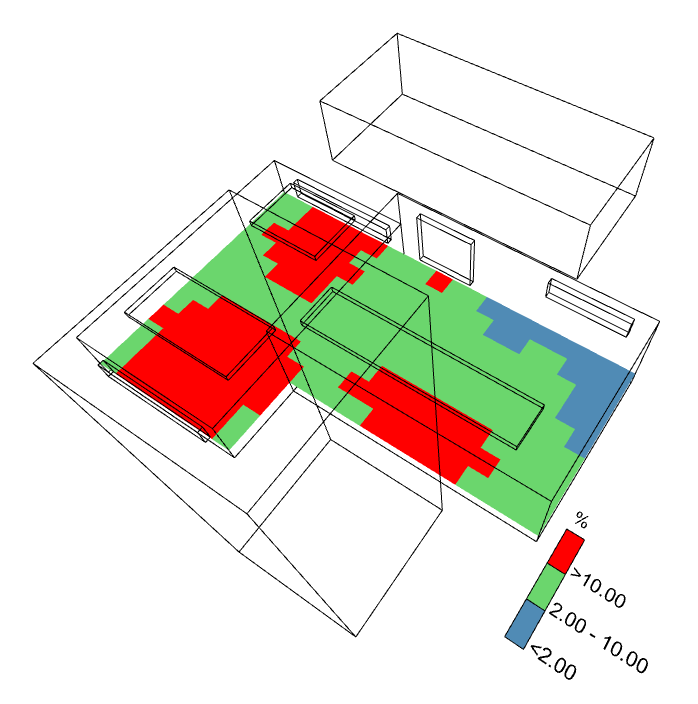
Catrgorized_Legend.json (30.3 KB)
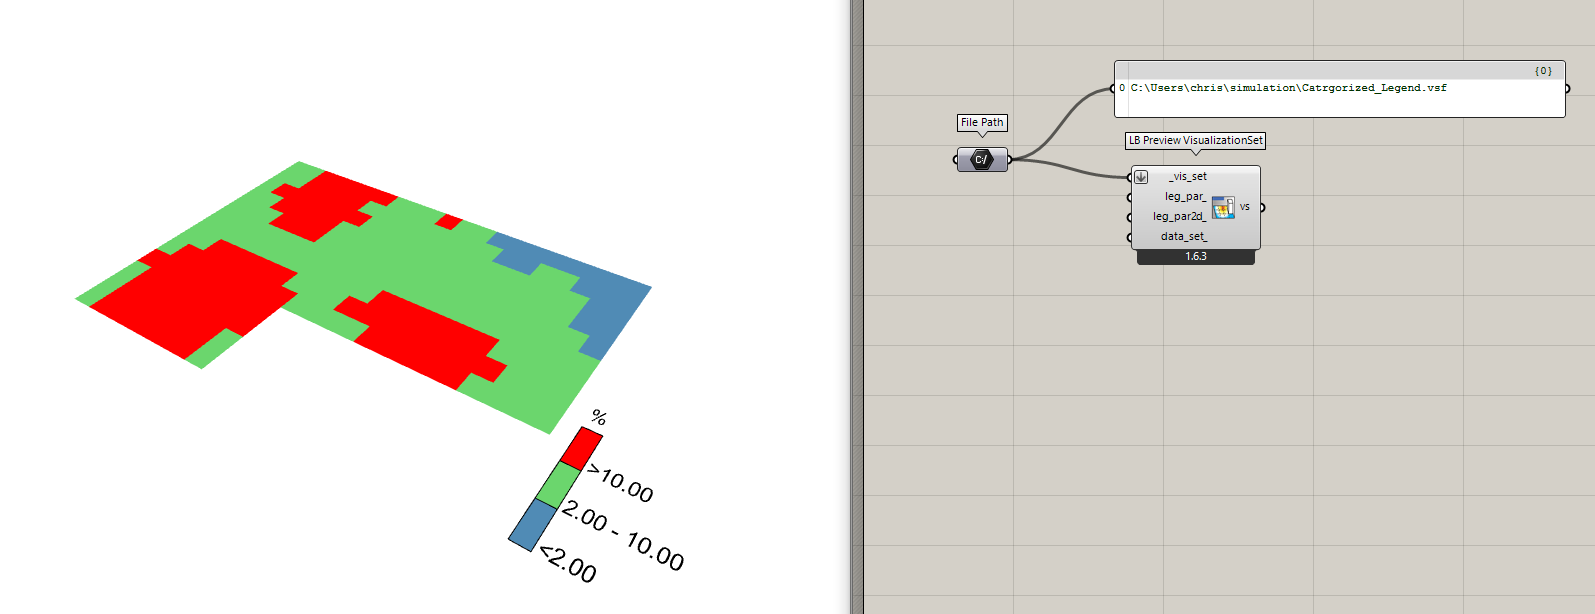
The LegendParametersCategorized object is fully supported if you are previewing the visualization set in Rhino or with the LBT Grasshopper components. If you bake the VisualizationSet into the 3dm file, I don’t think the categories will come through yet but we can add support for this if you’ll be using it (CC: @mingbo).
The categorized legend is also not yet supported if you’re using the Pollination Viewer that’s based on VTK but we should also be able to add this quickly if you need it.
Hello @chriswmackey ,
Thank you for all the information.
I’m trying to use the LegendParametersCategorized class but for some reason the send_results function is not able to preview the content on Rhino. I even tried to preview the json file you sent, but didn’t work either.
Hi @lucaslima ,
If you have the app code that you are using to send the results, I can take a look but I don’t have any issues previewing it with the Grasshopper components:
preview_vis_set_categorized.gh (8.9 KB)
Maybe @mingbo might know what is happening in the pipeline of the send_results preview. I had thought that the VisualizationSet gets sent directly to the same code that is used by the Grasshopper component when previewing it but maybe there’s something else I’m missing.
I may have to add the LegendParametersCategorized into the schema we use for VisualizationSet.
@mingbo , let me know if this is correct when you get the chance.
I have a workaround for you, @lucaslima , until we get the categorized legend parameters supported, which is to just convert all of the data into your visualization set into integers and then use the ordinal_dictionary of the normal LegendParameters to map the integers to text.
Here is a sample JSON file:
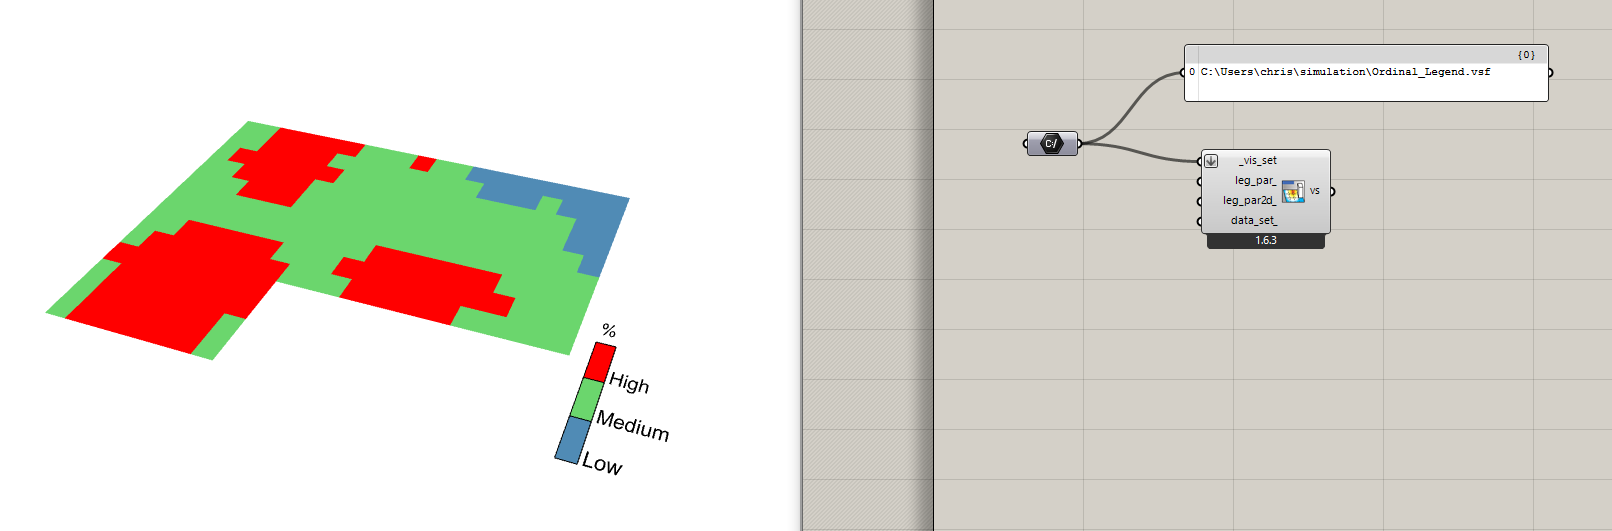
Ordinal_Legend.vsf (27.5 KB)
It’s a little more setup that you’ll have to do in the app. But, if you use this workaround, it should work with the current implementation in the Rhino plugin and in the Pollination Viewer.
Thank you for looking into that @chriswmackey !
I will give it a try and will comment here how it goes.
I’m afraid it still doesn’t work as I need it to.
I’m working with a lot of decimal values, and to better the coloring precision, the value ranges would have to be defined in decimals as well. I tried defining it inside the ordinal_dictionary parameter, even though I’m guessing it is made only for integers as text.
I’m trying to define the legend parameters to work on the send_results preview as something like this:
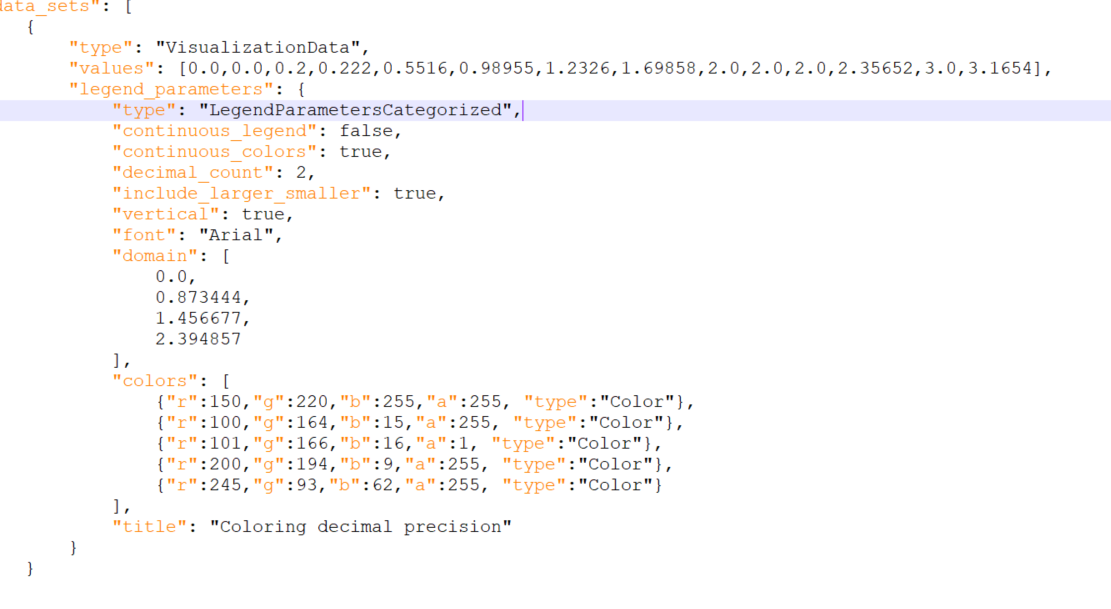
I guess that’s only possible with the LegendParametersCategorized class (once it is supported within the send_results preview button). Is that right?
Hi @lucaslima,
Can you share a sample file with us? Both the results and the visualization file would be great but only sharing the VisualizationSet can be enough.