Hi @mostapha , continuing the conversation here–I was able to get daylight analysis grids to display in Rhino, but I’m still unclear how I can get a room-by-room percentage breakdown that I can use for, say, LEED compliance or target-setting. How can I get this data to display without having to write a grasshopper script (which is fine with me, but I’m trying to set up a workflow for others in the office to use!)
Hey, @mishasemenov! Thank you for posting your question here.
As you mentioned the most flexible approach is to use Grasshopper.
The are two other options:
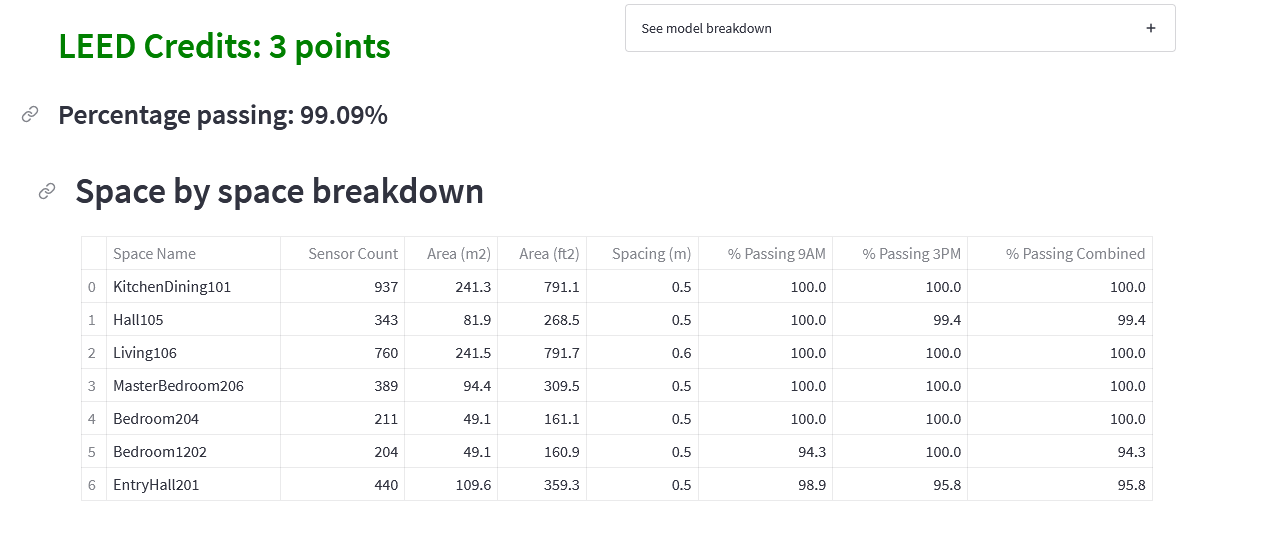
Using/editing a recipe. As a matter of fact, we already have two recipes for LEED. The one for Option II does the averaging and generates the report for each room. We have been really slow in releasing it. cc: @chriswmackey and @mikkel
We have been mainly focused on fixing features during this year since without a clean model the results are not really reliable and also that’s what the offices were willing to pay for. It is really hard to compete with what the Ladybug Tools Grasshopper plugin offers! That said we are in the process of closing the loop by better integration of the panel and the apps.
I will be posting our plan for 2023, and it will be great to hear your thoughts about it.