There is also another issue with LegendParameters - the minimum and maximum functions do not work - this can be a new topic though -
with st.expander('Windrose'):
windrose_st_month = st.number_input(
'Start month', min_value=1, max_value=12, value=1, key='windrose_st_month')
windrose_end_month = st.number_input(
'End month', min_value=1, max_value=12, value=12, key='windrose_end_month')
windrose_st_day = st.number_input(
'Start day', min_value=1, max_value=31, value=1, key='windrose_st_day')
windrose_end_day = st.number_input(
'End day', min_value=1, max_value=31, value=31, key='windrose_end_day')
windrose_st_hour = st.number_input(
'Start hour', min_value=0, max_value=23, value=0, key='windrose_st_hour')
windrose_end_hour = st.number_input(
'End hour', min_value=0, max_value=23, value=23, key='windrose_end_hour')
def get_windrose_figure_temp(st_month: int, st_day: int, st_hour: int, end_month: int,
end_day: int, end_hour: int, _epw, global_colorset) -> Figure:
"""Create windrose figure.
Args:
st_month: A number representing the start month.
st_day: A number representing the start day.
st_hour: A number representing the start hour.
end_month: A number representing the end month.
end_day: A number representing the end day.
end_hour: A number representing the end hour.
epw: An EPW object.
global_colorset: A string representing the name of a Colorset.
Returns:
A plotly figure.
"""
lb_ap = AnalysisPeriod(st_month, st_day, st_hour, end_month, end_day, end_hour)
fields = get_fields()
windrose_data = SI_IP_Check(_epw.import_data_by_field(fields['Dry Bulb Temperature']))
wind_dir = _epw.wind_direction.filter_by_analysis_period(lb_ap)
windrose_dbt_ = windrose_data.filter_by_analysis_period(lb_ap)
lb_lp = LegendParameters(colors=colorsets[global_colorset], max = 60)
lb_windrose_temp = WindRose(wind_dir,windrose_dbt_)
lb_windrose_temp.legend_parameters = lb_lp
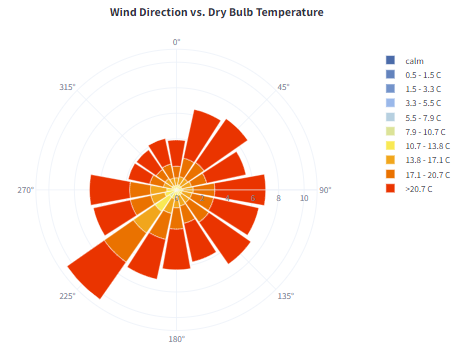
return lb_windrose_temp.plot(title='Wind Direction vs. Dry Bulb Temperature', show_title=True)
windrose_figure_temp = get_windrose_figure_temp(windrose_st_month, windrose_st_day, windrose_st_hour, windrose_end_month,
windrose_end_day, windrose_end_hour, global_epw, global_colorset)
st.plotly_chart(windrose_figure_temp, use_container_width=True,
config=get_figure_config(f'Windrose_{global_epw.location.city}'))